Tracking Volatility
Traders generally bid up the VIX only after the market has taken a big hit. They are desperate to hedge their long positions by owning something that will rise in value if equity prices continue dropping.
Volatility pricing can move much faster than the market itself. A 25% or greater premium to the underlying change in the S&P index (SPX) indicates intense fear. Scared traders dump stocks just for peace of mind. They no longer care about intrinsic value. They simply demand less risk.
Moods and share prices can continue on negative paths for a while, but periods of ultra-high VIX prices typically occur within just weeks or months of major bottoms.
When VIX Flies, Investors Should Buy
Those with reasonable time horizons were never disappointed. The most recent spike on October 15, 2014, will likely add to the list of most wonderful times to increase exposure to stocks.
Students of market history might be curious to back check this theory to before 2008’s financial meltdown. The CBOE has provided us with a great chart superimposing the SPX and the VIX since 1990.
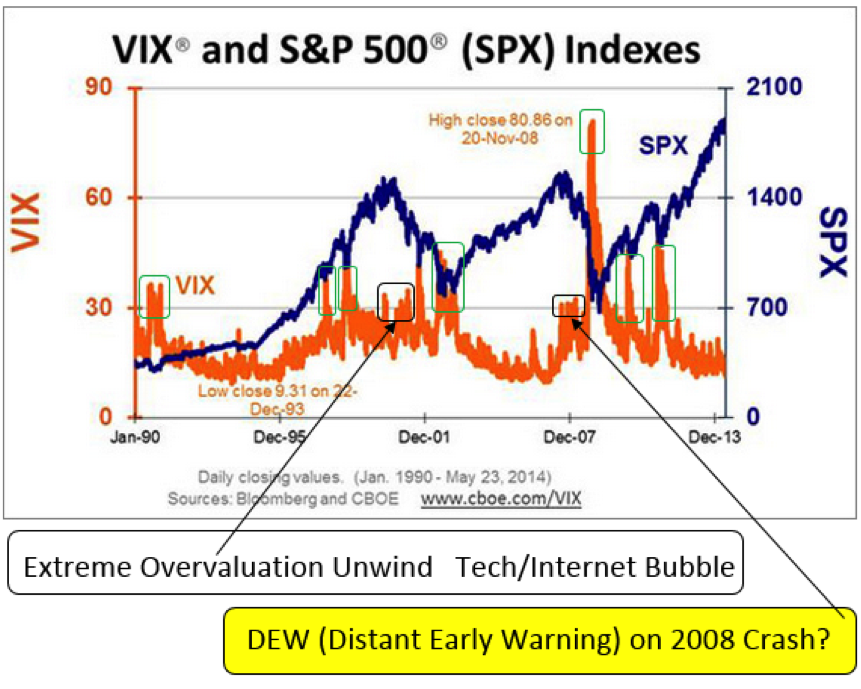
A high VIX did not protect against buying too soon after the outrageous excesses of the March 2000 pinnacle. Stocks were so expensive that it took longer than normal to see a rebound. The skyrocketing VIX after the 9/11 terrorist attacks gave a much more timely BUY indication.
VIX prices ramped up to about 30 in late 2007 to early 2008, preceding a short rally. The broad market, however, crashed much lower in the fall of that year after Lehman’s bankruptcy and AIG’s bailout. That year’s sell-off was more credit related than due to valuation excesses.
On November 20, 2008, VIX closed at a stunning 80.86. That turned out to be the point of maximum panic even though it took until March 9, 2009, for momentum to reverse completely. Maximum pessimism meant enormous profits for fund buyers who recognized off-the-charts volatility as a reason to buy. The S&P 500 more than tripled from its eventual low, just three and a half months later.
There is never a time when stocks cannot go lower. The old saying that, “You don’t get hurt jumping out of basement windows,” still applies though.
The Bottom Line
If you’ve enjoyed this article, sign up for the free MutualFunds.com newsletter; we’ll send you similar content weekly.