As expected, the central bank raised rates by 25 basis points to 5.25%, marking the 10th consecutive increase since March 2022. This also brought borrowing costs to their highest level since September 2007. Investors initially cheered the Fed’s rate hike as the central bank removed a key statement from its press release, suggesting that it may be done with the cycle. However, during Chairman Powell’s speech, he mentioned that additional tightening may be needed to reduce inflation further and cool the stubbornly tight labor market. Although the JOLTS report showed that employers posted nearly 348,000 fewer job vacancies in March compared to February, there continues to be plenty of work available for Americans in the form of unfilled positions. The US economy also unexpectedly added 253,000 jobs in April 2023, well above forecasts. Similarly, the unemployment rate also showed strength, as it fell to a multi-decade low of 3.4%. With the strong labor numbers and potentially dwindling inflation, investors sent stocks rebounding by the end of the week, predicting that the Fed may actually pull off a soft landing and not send the economy into recession.
Next week, investors will once again have to deal with the bogey man of the moment – inflation. The CPI reading for April will be released on Wednesday. Last month, the CPI rose 0.1%, slowing down and coming in below analysts’ forecasts of a 0.2% gain. This set the annual pace of price increases in March at just 5%, the ninth straight month of declines. For April, analysts peg the month-over-month increase to the CPI at 0.3%, setting the annual rate of inflation at 4.9%. Aside from consumer inflation data, producer-based inflation will also be released, with the PPI reading on Thursday. Last month, PPI recorded a surprise -0.5% dip, showing signs of deflation. However, analysts expect that to be a seasonal phenomena, predicting the PPI to rise by 0.1% in April. These dips in inflation have been met with rising consumer demand and confidence. The University of Michigan Consumer Sentiment Report clocked in at 63.5 in April. When the latest report comes out on Friday, analysts expect it to rise to 64, showing increased consumer confidence in the economy.
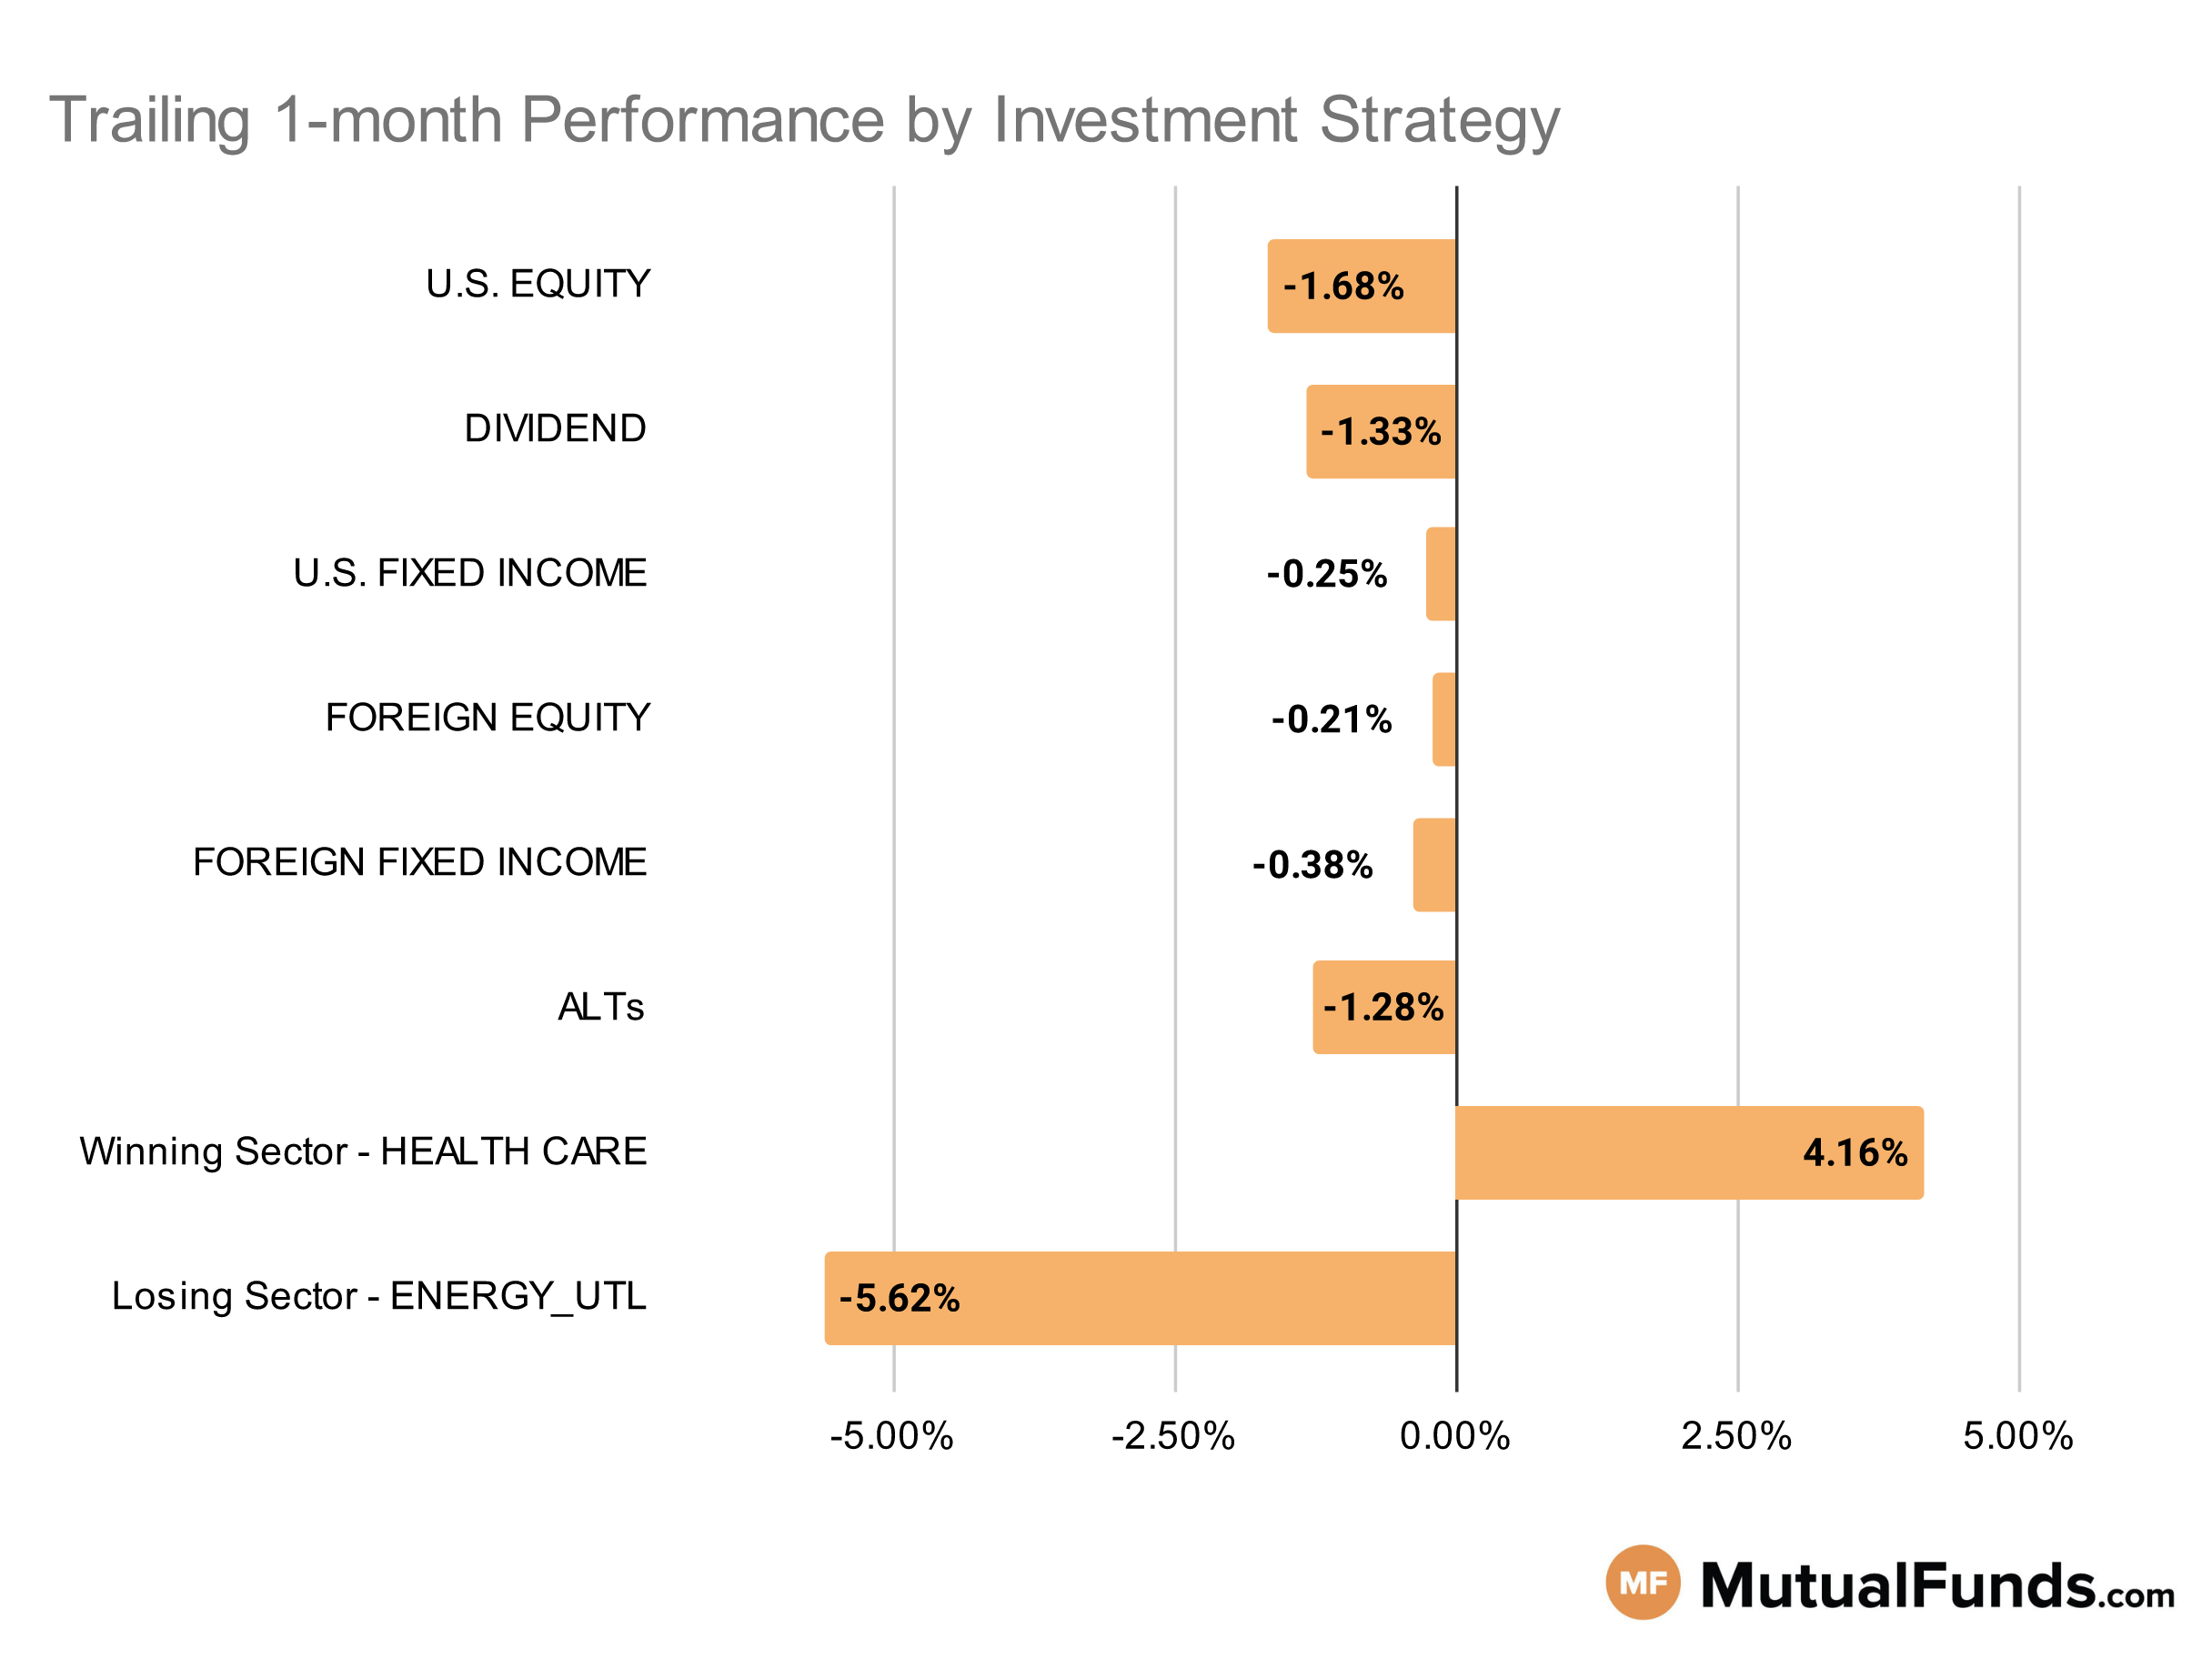
Given this economic backdrop, let us see how this impacts the performance of various investment strategies.
Investment Strategy Scorecard
U.S Equity Strategies
In U.S. equities, mid and large cap strategies outperformed others over the last trailing month. On the other hand, just like last week, small-cap strategies continued to struggle.
Winning
- Touchstone Mid Cap Fund (TMCJX) , up 1.99%
- Mairs & Power Growth Fund (MPGFX), up 1.57%
- Schwab U.S. Large-Cap Growth ETF™ (SCHG) , down -0.4%
- iShares Morningstar Growth ETF (ILCG), down -0.56%
Losing
- Dimensional U.S. Targeted Value ETF (DFAT) , down -4.76%
- Invesco S&P SmallCap 600 Revenue ETF (RWJ), down -5.3%
- Undiscovered Managers Behavioral Value Fund (UBVLX) , down -6.34%
- Bridgeway Omni Small-Cap Value Fund (BOSVX), down -7.54%
Dividend Strategies
When it comes to income, foreign and dividend growth strategies won while high dividend and concentrated dividend portfolio strategies lost over the trailing one month period.
Winning
- SPDR® S&P International Dividend ETF (DWX) , up 2.02%
- Amana Mutual Funds Trust Income Fund (AMANX), up 1.96%
- ProShares S&P 500 Dividend Aristocrats ETF (NOBL) , up 0.88%
- Janus Henderson Global Equity Income Fund (HFQAX), up 0.65%
Losing
- Federated Hermes Strategic Value Dividend Fund (SVAIX) , down -2.84%
- BNY Mellon Equity Income Fund (DQIRX), down -2.92%
- WisdomTree U.S. High Dividend Fund (DHS) , down -5.13%
- Invesco S&P Ultra Dividend Revenue ETF (RDIV), down -7.46%
U.S. Fixed Income Strategies
In US fixed income, strategies focused on shorting longer duration US treasuries benefited over the last trailing one month, while long-only strategies focused on longer duration US treasuries suffered.
Winning
- ProShares UltraShort 20+ Year Treasury (TBT) , up 3.03%
- ProShares Short 20+ Year Treasury (TBF), up 1.82%
- GMO Opportunistic Income Fund (GMOLX) , up 1.19%
- Voya Securitized Credit Fund (VCFAX), up 0.9%
Losing
- Invesco CEF Income Composite ETF (PCEF) , down -1.83%
- iShares Convertible Bond ETF (ICVT), down -1.93%
- Vanguard Extended Duration Treasury Index Fund (VEDIX) , down -2.72%
- PIMCO Extended Duration Fund (PEDPX), down -2.77%
Foreign Equity Strategies
Among foreign equity strategies, Swiss and Indian equities came out as the top performing strategies, while emerging market strategies including those focused on China continued to lose.
Winning
- iShares MSCI Switzerland ETF (EWL) , up 6.48%
- WisdomTree India Earnings Fund (EPI), up 4.25%
- Oakmark International Fund (OANEX) , up 3.65%
- Oakmark International Small Cap Fund (OAZEX), up 3.65%
Losing
- Fidelity® China Region Fund (FHKCX) , down -5.12%
- iShares Asia 50 ETF (AIA), down -5.35%
- Matthews Asia Innovators Fund (MATFX) , down -5.39%
- EMQQ The Emerging Markets Internet & Ecommerce ETF (EMQQ), down -7.93%
Foreign Fixed Income Strategies
Among foreign debt, while emerging market local currency based debt strategies continued their winning streak from last week, some high yielding strategies from emerging markets lost.
Winning
- PIMCO Emerging Markets Local Currency and Bond Fund (PELPX) , up 0.87%
- Eaton Vance Emerging Markets Local Income Fund (EEIIX), up 0.84%
- iShares International Treasury Bond ETF (IGOV) , up 0.05%
- VanEck J.P. Morgan EM Local Currency Bond ETF (EMLC), up 0.04%
Losing
- John Hancock Funds Emerging Markets Debt Fund (JEMIX) , down -0.96%
- Stone Harbor Emerging Markets Debt Fund (SHMDX), down -1%
- iShares J.P. Morgan USD Emerging Markets Bond ETF (EMB) , down -1.4%
- VanEck Emerging Markets High Yield Bond ETF (HYEM), down -2.34%
Alternatives
Among alternative strategies, silver, gold and volatility strategies expected to profit from decreases in expected volatility continued to win. On the contrary, broader commodity based strategies lost.
Winning
- ProShares Ultra Silver (AGQ) , up 7.66%
- AQR Managed Futures Strategy Fund (AQMIX), up 2.9%
- ProShares Short VIX Short-Term Futures ETF (SVXY) , up 2.6%
- Fidelity® Select Gold Portfolio (FSAGX), up 2.46%
Losing
- ALPS/CoreCommodity Management CompleteCommoditiesSM Strategy Fund (JCRAX) , down -4.97%
- PIMCO CommoditiesPLUS® Strategy Fund (PCLAX), down -7.32%
- iShares S&P GSCI Commodity-Indexed Trust (GSG) , down -8.87%
- ProShares Ultra VIX Short-Term Futures ETF (UVXY), down -9.83%
Sectors
Among the various sectors, just like last week, biotech strategies continued to win over the last trailing month. However, oil and gas strategies pulled back significantly.
Winning
- Direxion Daily S&P Biotech Bull 3X Shares (LABU) , up 32.99%
- SPDR® S&P Biotech ETF (XBI), up 11.13%
- Eventide Healthcare & Life Sciences Fund (ETAHX) , up 9.61%
- Fidelity Advisor® Biotechnology Fund (FBTAX), up 8.5%
Losing
Methodology
Here is a summary of different strategies covered in this article:
- U.S. equity strategies typically cover different equity investing styles (growth/value/blend) and market capitalizations (small/mid/large).
- Dividend strategies focus on generating income via different equity routes (high yield/dividend growth/foreign dividend/quality dividend)
- U.S. fixed income strategies focus on debt securities issued by U.S. entities and can cover different types of debt (corporate/municipal/high-yield/investment-grade/government/asset-backed) and maturity profiles (short/medium/long).
- Foreign equity strategies cover equity strategies applied to non-U.S. markets based on the level of economic growth (emerging/developed), regions (Asia/Europe/Africa), and market capitalizations (small/mid/large).
- Foreign fixed income strategies focus on debt securities issued outside the U.S. markets and can cover different regions (Asia/Europe/Africa) and regions based on the level of economic development (emerging/developed).
- Alternative strategies cover non-traditional investments (currencies, hedge funds strategies, derivatives, volatility-based), real estate, and commodities.
- Sector strategies cover dedicated exposure to various sectors of the U.S. economy including technology, healthcare, financial, and industrial among others.