• The Fed will tolerate higher inflation, which will lead to even more-negative real interest rates.
• I describe the implications of negative real interest rates for major asset classes: bonds, stocks, and gold.
In my previous article “The Fed Wants Inflation,” I argued that the Fed’s recent shift to targeting average inflation (rather than a simple 2% level) will likely lead to higher inflation and therefore to more-negative real (net of inflation) interest rates. Today, I focus on the implications of this for major asset classes.
Implications for Bonds and Stocks
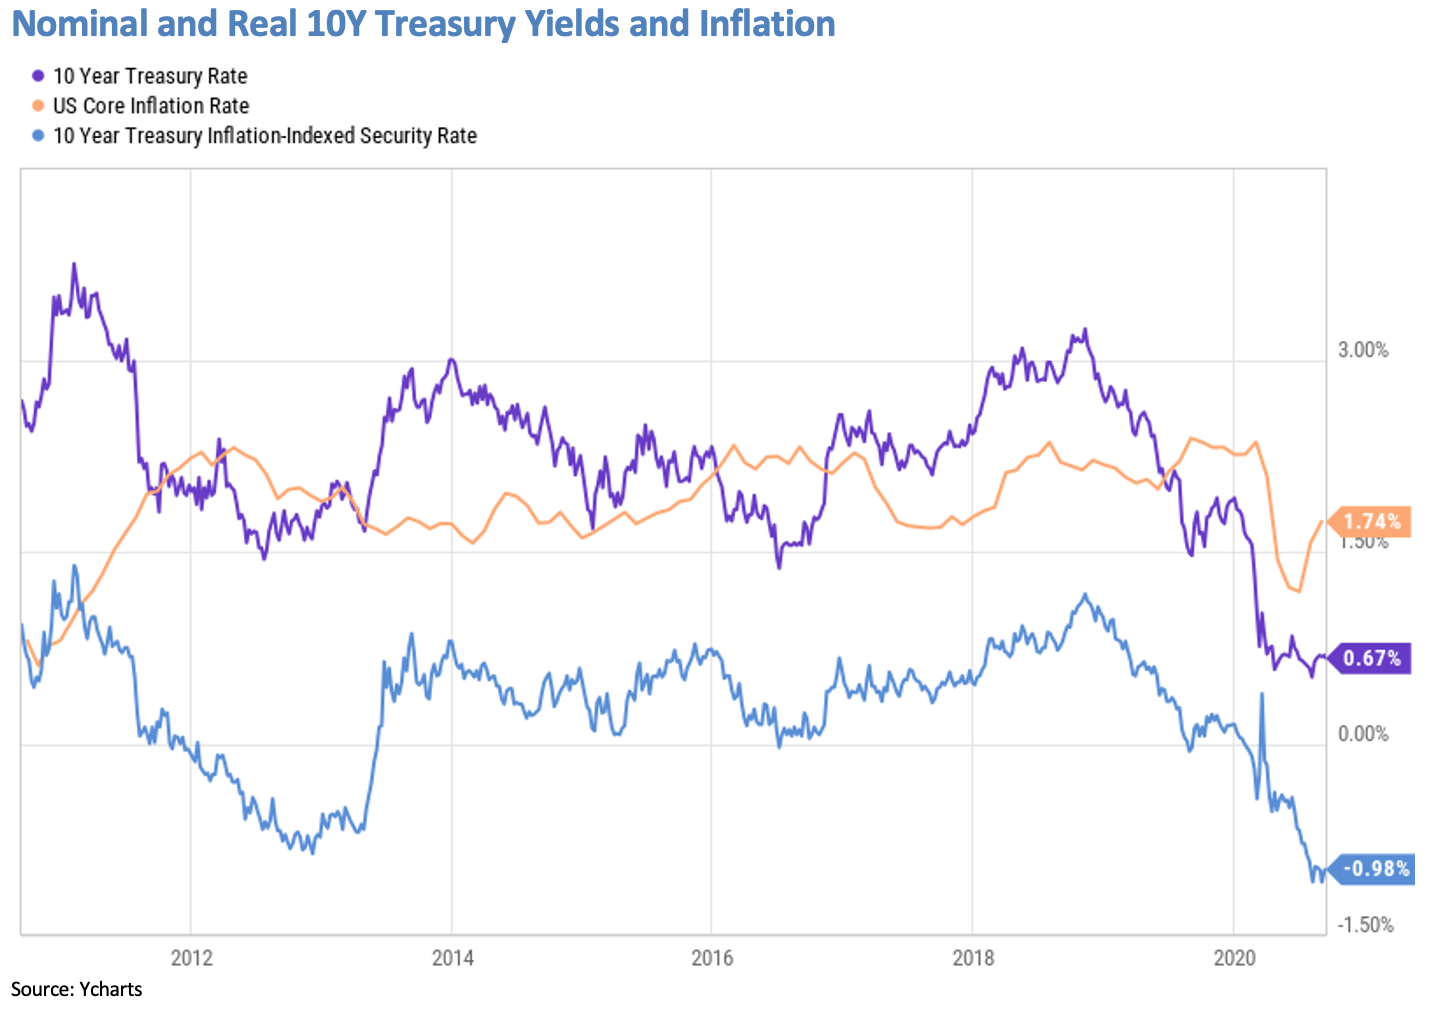
Corporate bonds, with their slightly higher yields, are barely making up for inflation. If inflation rises, then all bond investors will lose in real terms. This loss will come over time (if bonds are held to maturity) or sooner on a market-value basis, if the Fed lets interest rates rise. Rising rates would be devastating given the enormous debt load – but that’s a separate discussion.
As I have written before, the recent rally has brought stocks to extremely overvalued levels. The S&P 500 is traded at 3.8 times its book value in mid-September – its highest since Jan-2001 (which preceded the 2001-02 bear market) and well above its 2007 and 2019 levels. In its 150-year history, Shiller’s P/E ratio has been higher only in 2018 and during the dot-com bubble of 1998-2001:
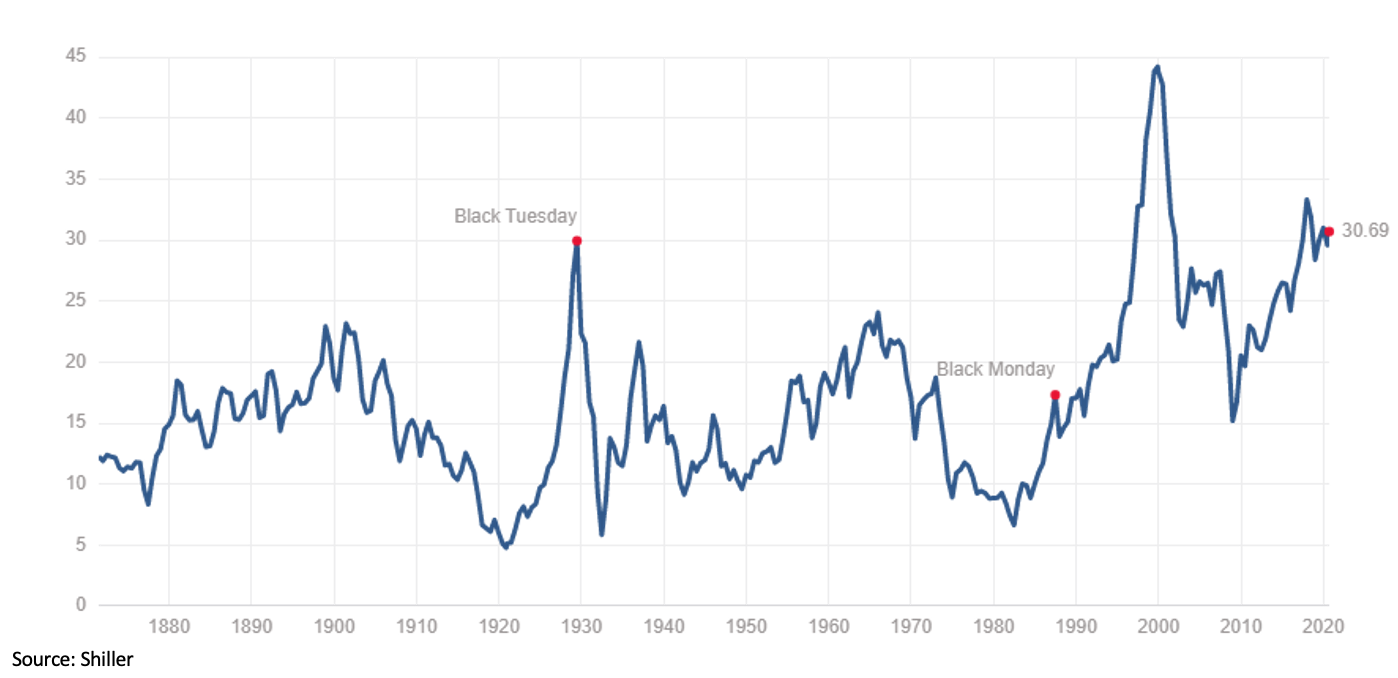
A popular argument for higher stock valuation has been that interest rates are lower. So, a hint of rising inflation and interest rates might be the pin that pricks the stock bubble. Recall that as the Fed was normalizing interest rates in 2018, the 10-year yield crossing above 3% in October-2018 was what initially triggered the selloff. This time, the threshold is likely much lower because of larger debt and near-zero (or negative) global interest rates.
A Case for Gold
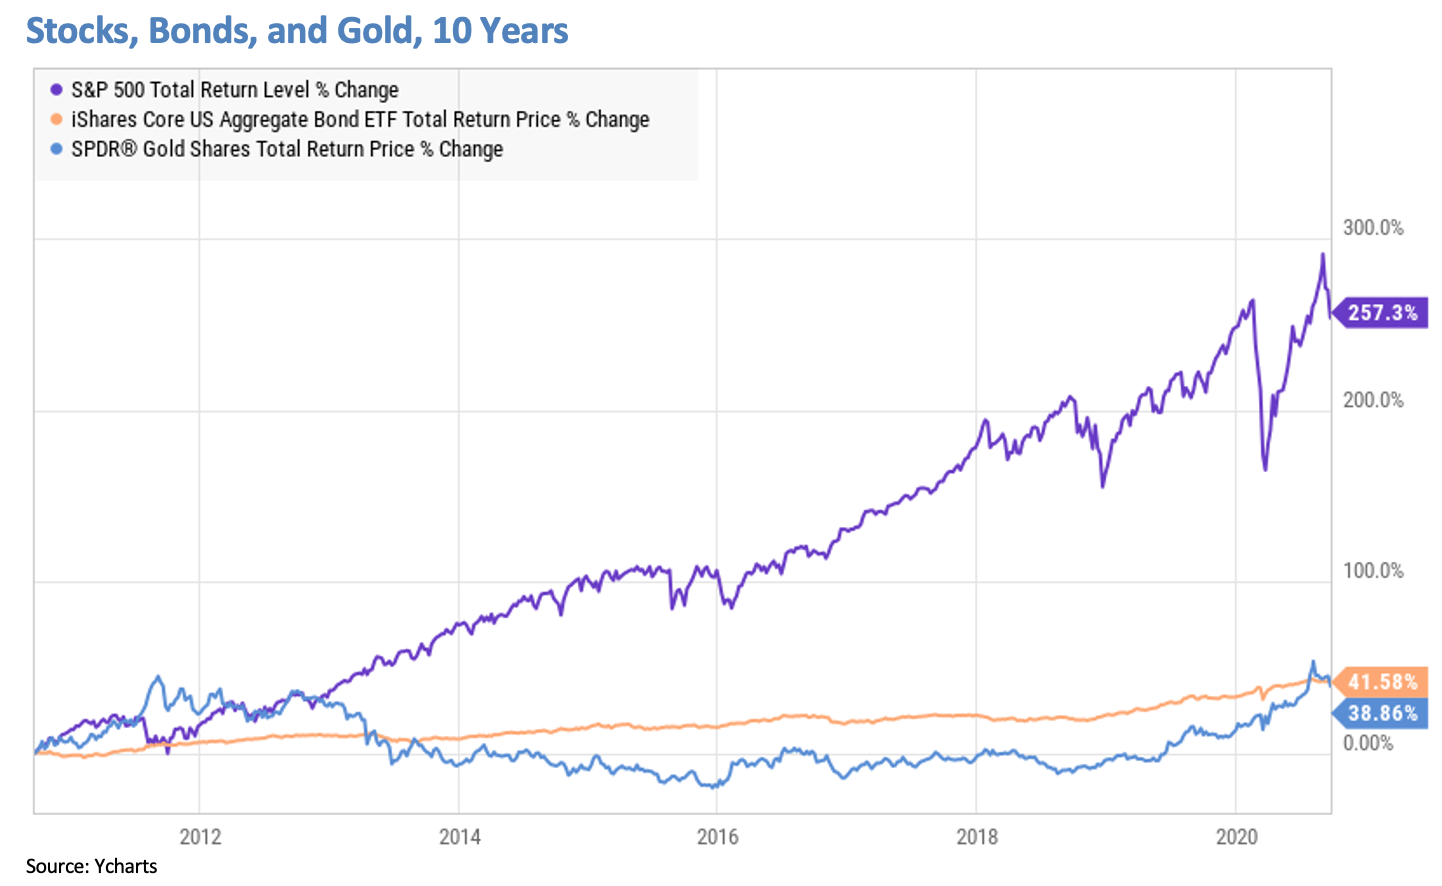
Gold price rallied this year to a new all-time high in early August, along with most precious and industrial metals. If we take a longer-term view, however, then gold’s 10-year total return almost exactly matches bonds (see chart) and well below the S&P 500’s 273 over-250% run. I wouldn’t be surprised if gold and stocks converge somewhere in the middle in the coming years. In the short term, our Gold model remains positive. The price correction since early August trimmed the year-to-date gain to 23% and makes an attractive entry point, in my view.
About Model Capital Management
Notices and Disclosures
2. MCM does not provide individually tailored investment advice. MCM Research has been prepared without regard to the circumstances and objectives of those who receive it. MCM recommends that investors independently evaluate particular investments and strategies, and encourages investors to seek the advice of an investment adviser. The appropriateness of an investment or strategy will depend on an investor’s circumstances and objectives. The securities, instruments, or strategies discussed in MCM Research may not be suitable for all investors, and certain investors may not be eligible to purchase or participate in some or all of them. The value of and income from your investments may vary because of changes in securities/instruments prices, market indexes, or other factors. Past performance is not a guarantee of future performance, and not necessarily a guide to future performance. Estimates of future performance are based on assumptions that may not be realized.
3. MCM Research is not an offer to buy or sell or the solicitation of an offer to buy or sell any security/instrument or to participate in any particular trading strategy. MCM does not analyze, follow, research or recommend individual companies or their securities. Employees of MCM may have investments in securities/instruments or derivatives of securities/instruments based on broad market indices included in MCM Research.
4. MCM is not acting as a municipal advisor and the opinions or views contained in MCM Research are not intended to be, and do not constitute, advice within the meaning of Section 975 of the Dodd-Frank Wall Street Reform and Consumer Protection Act.
5. MCM Research is based on public information. MCM makes every effort to use reliable, comprehensive information, but we make no representation that it is accurate or complete. We have no obligation to tell you when opinions or information in MCM Research change.
6. MCM DOES NOT MAKE ANY EXPRESS OR IMPLIED WARRANTIES OR REPRESENTATIONS WITH RESPECT TO THIS MCM RESEARCH (OR THE RESULTS TO BE OBTAINED BY THE USE THEREOF), AND TO THE MAXIMUM EXTENT PERMITTED BY LAW, MCM HEREBY EXPRESSLY DISCLAIMS ALL WARRANTIES (INCLUDING, WITHOUT LIMITATION, ANY IMPLIED WARRANTIES OF ORIGINALITY, ACCURACY, TIMELINESS, NON-INFRINGEMENT, COMPLETENESS, MERCHANTABILITY AND/OR FITNESS FOR A PARTICULAR PURPOSE).
7. “Model Return Forecast” for 6-month S&P 500 return is MCM’s measure of attractiveness of the U.S. equity market obtained by applying MCM’s proprietary statistical algorithm and historical data, but is not promissory, and, by itself, does not constitute an investment recommendation. Model Return Forecasts were calculated and applied by MCM to its research and investment process in real time beginning from 2012. For periods prior to Jan 2012, the results are “back-tested,” i.e., obtained by retroactively applying MCM’s algorithm and historical data available in Jan 2012 or thereafter. Source for the S&P 500 actual returns: S&P Dow Jones.
8. Index returns referenced in MCM Research, if any, are gross of any advisory fees, fund management fees, and trading expenses. Fund or ETF returns referenced, if any, are gross of advisory fees and trading expenses. Returns will be reduced by fees and expenses incurred.