This is a special edition of the scorecard that looks at the performance of most prominent mutual funds over the past year. This aims to give readers a snapshot of what mutual funds posted the best and worst performance year-to-date and explain why. The performance is calculated from January 1 to November 30.
- Overall, mutual funds experienced another year of carnage in terms of flows. Around $43 billion were withdrawn from mutual funds year-to-date, with equities particularly disliked by investors. Equities had outflows of around $126 billion. Bond mutual funds saw positive flows of $124 billion, while hybrid funds experienced $41 billion in outflows.
- The flow picture for 2018 is similar to 2017 and 2016, with strong outflows from equities were offset by bond inflows. However, one difference between 2018 and 2017 is that last year total outflows were positive at $67 billion. 2016 was the worst of the three years, with total outflows standing at $196 billion.
- The macroeconomic footprint was driven by several factors. In the second year of the Donald Trump presidency, he delivered on some of his promises and started a trade war with China, although a temporary truce was reached lately. A positive for markets overall were Trump’s tax cuts, which gave a boost to the U.S. GDP.
- The Federal Reserve continued to raise interest rates this year but signaled recently it may put the brakes on future rate hikes.
- The Eurozone economy slowed down in 2018 after a few strong years, thanks to the support provided by the European Central Bank.
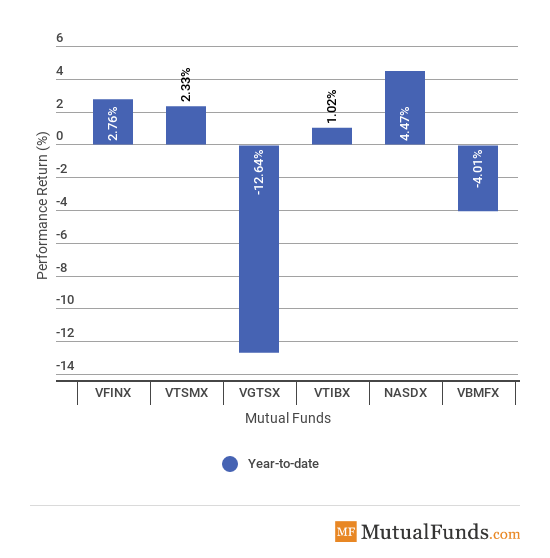
Broad Indices
- Technology stocks (NASDX) were the best performers for the year, as Netflix, Amazon and Microsoft continued their ascent on strong growth in their core businesses. Amazon and Microsoft were also boosted by their respective cloud services businesses.
- On the other side of the spectrum are international stocks (VGTSX), which fell 12.6%. With exposure to Europe, China and Japan, the fund suffered losses as the U.S. economy diverged from the rest of the world thanks to tax cuts at home and trade wars abroad.
- The bond market (VBMFX) also suffered losses of 4% for the year, as yields in the U.S. were on the rise. Ten-year Treasury yields crossed the 3% threshold for the first time in years.
We also provide this report on a fortnightly basis. To stay up to date with mutual fund market events, come back to our news page here..
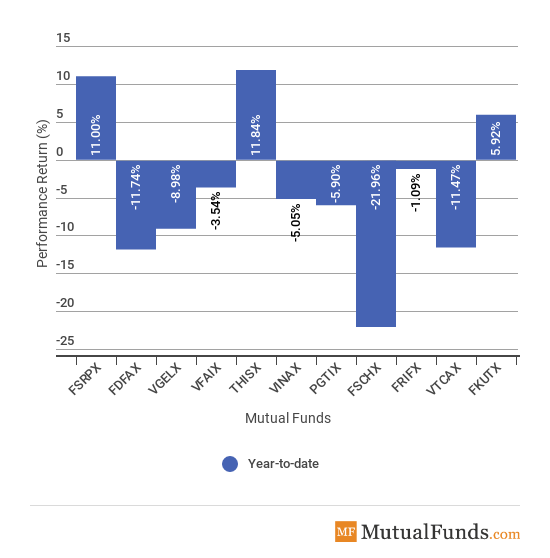
Major Sectors
- After years of experiencing a beating, the retail sector finally had a respite year, with Fidelity Select Retailing Portfolio (FSRPX) returning 11%. Many retailers, particularly in the department store sector, saw their first fruits of a brutal restructuring in previous years. Strong consumer sentiment also boosted sales across the sector.
- The best performer for the year, however, was the healthcare sector, with T. Rowe Price Health Sciences Fund I Class (THISX) rising more than 11%.
- The worst performer from the pack was the chemicals industry (FSCHX) with a decline of nearly 22%. The poor performance was led by DowDuPont, which makes up a fourth of the index, and Linde, which has a weight of 25%.
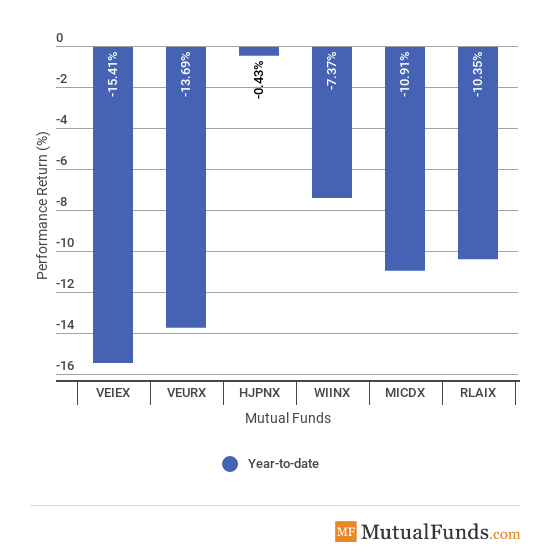
Foreign Funds
- Outside the U.S., most important stock markets were in the red.
- Emerging markets (VEIEX) declined 15.4%, as a strong dollar combined with rising yields in the U.S. and a trade war weighed on sentiment. Currency crises in Turkey and Argentina, meanwhile, triggered fears of contagion.
- The best performer was the Japanese stock market (HJPNX), which declined by just 0.43%. Japan has been largely insulated from the global jitters, but its domestic problems were enough to cause underperformance. The year in Japan was marked by the central bank’s inability to reach its inflation target despite showering the economy with free money.
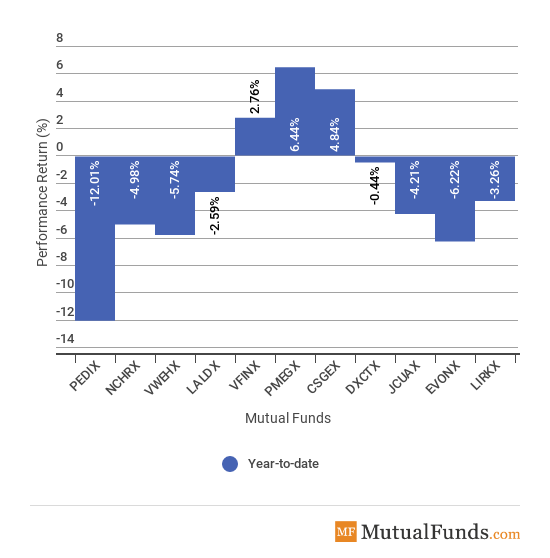
Major Asset Classes
- Long-term bonds (PEDIX) were by far the worst performers for the year, declining as much as 12%. Rising Treasury yields and the flattening of the yield curve hit the long-term bonds hard. As the Federal Reserve signaled plans to withhold on raising interest rates for a while, long-term bonds may stage a recovery.
- Mid-cap equities (PMEGX), meanwhile, surged 6.44% this year, representing the best performance.
The Bottom Line
Technology stocks posted the best performance in 2018, in a year marked by trade wars, rising Treasury yields, and a divergence between the economies of the U.S. and the rest of the world. Total mutual fund outflows were negative this year after experiencing inflows last year. The retail sector swung back this year, proving that years of restructurings were worth doing. Finally, emerging markets suffered severe outperformance due to trade wars and currency crises.
Be sure to sign up for your free newsletter here to receive the most relevant updates.