The dynamic nature of the yield curve typically showcases how certain market forces and political decision making are impacting capital markets, and more importantly, the economy in general. From normal yield curve to flattened shape and then to some form of inversion are all indicative of the financial market conditions at a particular time – and, since it illustrates time/maturity related to the interest rates, investors watch the yield curve shapes very closely.
In this article, we will take a closer look at the different shapes of the yield curve and what the current yield curve indicate.
Be sure to check our Municipal Bonds Channel to stay up to date with the latest trends in municipal financing.
What Influences the Yield Curve?
There are many factors that can impact the yield curve shapes – but primarily, the federal government’s actions and outlook will determine where the rates should be headed – whether that’s accomplished through their quantitative easing or quantitative tightening. In any event, if the Fed is thinking that we need to revive the economy after some form of a financial downturn, it will likely cut interest rates, which will bring down the rates for things like consumer borrowing and low relative returns for deposits/investments. The same is true for an economic outlook where inflation and economic expansion needs taming. The Fed would look to increase rates to bring stability and then try warding off a scenario for a possible economic downturn. For example, in an environment of low inflation and slow economic growth, investors are generally risk-averse and typically seek safety in the form of fixed income instruments, which puts a downward pressure on yields. On the other hand, an environment of relatively higher inflation and economic growth puts an upward pressure on yields.
Looking at the current economic conditions, the rising inflation in the U.S. has been a hot topic in the domestic financial news for a few months now. The recent March data shows that U.S. inflation surged to new heights in March 2022 to be around 8.5%, primarily driven by energy and food prices. This, paired with the existing supply constraints, isn’t helping issues.
Hence, the recent verdict from Jerome Powell, Chair of the U.S. Federal Reserve, entailed seeing up to five interest rate hikes to tame the inflationary pressures. The Fed fund rate and its movements – which entail the aforementioned five rate hikes – is what banks charge each other for overnight borrowing. This also sets the benchmark for things like consumer borrowing, including mortgages. The Fed fund rate is currently set at a target range of 0.75% to 1%, after two rounds of hikes this year – a 0.25% hike in March followed by a 0.5% hike in earlier this month.
Check out the differences between treasury and muni bond yield curves here.
Review of the Yield Curve Shapes
As the names suggest, these shapes directly correlate with the Treasury yields at different maturities on the curve. For example: for a flat yield curve, you would expect the shorter- and longer-term maturities to have relatively similar yields, which could indicate rapidly rising short-term interest rates, often controlled by the Fed with its quantitative tightening. Furthermore, this could indicate an economic expansion that the Fed is trying to control, including high inflation.
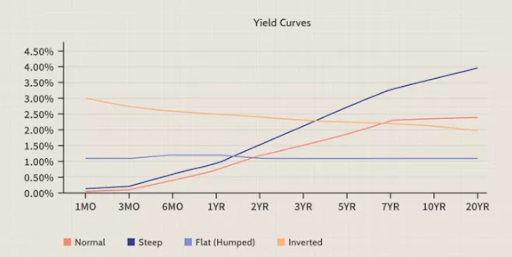
Normal Yield Curve: As shown in the image above, the red normal yield curve represents a “healthy” relationship between short- and long-term interest rates, indicating that the longer maturities are garnering higher yields than the short-term maturities. This is a common phenomenon, in which the longer you invest your funds, the higher the rates you should be expect. The same concept applies to shorter maturities garnering lower rates.
Flat Yield Curve: Shown in light blue, a flat yield curve indicates the same relative yields for maturities across the board, which tends to indicate a “not-so-normal” environment. As aforementioned, in a normal environment, investors should expect to get higher returns with respect to longer maturities. However, in a flat yield curve environment, the rates would be the same irrespective of timing.
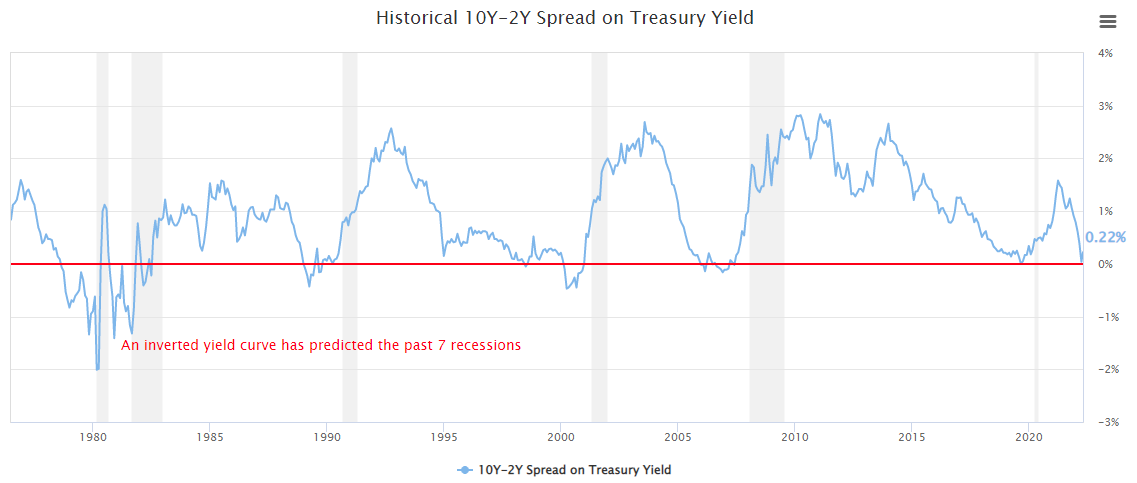
Inverted Yield Curve: It’s often argued that an inverted yield curve is indicative of an upcoming recession and there is research to show that all yield curve inversions, especially an inversion of 2- and 10-year yield spreads, have been followed by an economic downturn. In an inverted yield curve, investors would see higher short-term rates and lower yields for longer maturities. Hence, the chart below shows the track record of yield curve inversion and how it successfully predicted the financial downturn in the U.S.
Don’t forget to check our Muni Bond Screener.
The Bottom Line
Sign up for our free newsletter to get the latest news on municipal bonds delivered to your inbox.