News
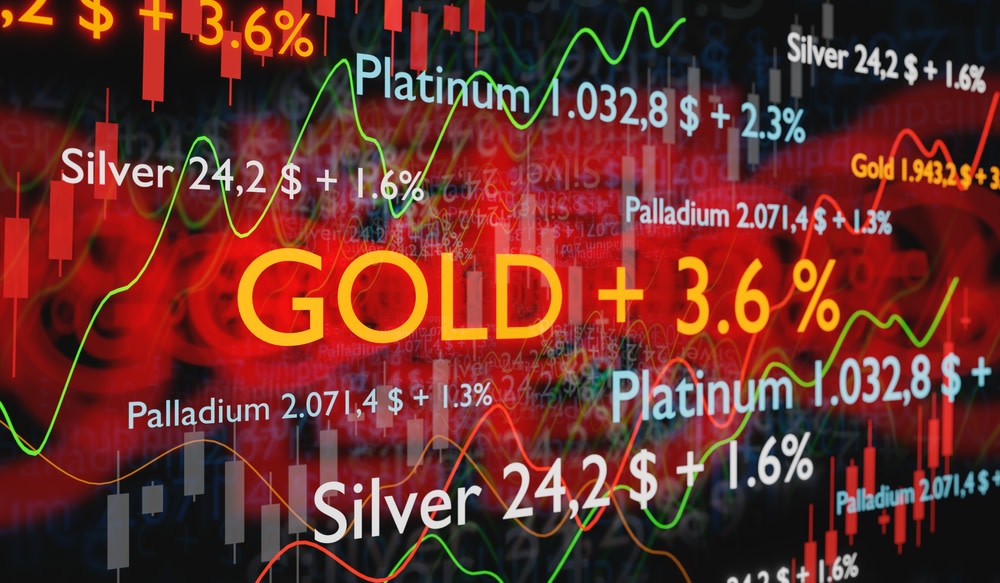
Precious Metals Continue to Outshine Tech and Biotech Over the Rolling Month
Shauvik Haldar
|
Overall, major U.S. stock indices were down for the rolling month.
Overview
Returns
Income
Allocations
Fees
About
JEPI | Active ETF
$56.42
+0.11%
$32.78 B
7.34%
$4.14
11.50%
7.60%
-
-
0.35%
FUSIX | Fund | Other
$12.11
+0.08%
$31.14 B
4.64%
$0.56
12.77%
2.01%
7.44%
5.60%
0.63%
FILFX | Fund | Other
$11.85
-0.08%
$19.37 B
4.74%
$0.56
10.97%
1.16%
7.04%
5.11%
0.73%
FSCSX | Fund | Other
$26.95
+0.19%
$12.40 B
15.69%
$4.23
32.55%
4.65%
15.26%
17.69%
0.64%
$34.76
-0.43%
$12.25 B
4.43%
$1.54
13.38%
5.23%
7.60%
4.84%
0.25%
JEPQ | Active ETF
$52.23
+0.25%
$11.84 B
9.82%
$5.13
30.58%
-
-
-
0.35%
FGOMX | Fund | Other
$11.83
+0.51%
$10.62 B
4.55%
$0.54
12.23%
-5.71%
3.20%
-
0.63%
$114.15
-0.14%
$10.38 B
7.20%
$8.21
10.46%
-2.19%
4.63%
3.59%
0.08%
FSAMX | Fund | Other
$10.72
+0.09%
$9.42 B
5.00%
$0.54
11.75%
-6.27%
2.55%
3.08%
0.78%
SCHE | ETF |
$25.28
+0.32%
$8.37 B
6.51%
$1.64
9.92%
-5.09%
1.97%
3.19%
0.11%
BTMKX | Fund | Other
$15.62
-0.51%
$8.18 B
5.86%
$0.92
9.93%
2.48%
6.31%
4.24%
0.04%
MDIIX | Fund | Other
$15.55
-0.13%
$8.18 B
5.37%
$0.84
9.99%
2.33%
6.20%
4.03%
0.34%
MAIIX | Fund | Other
$15.68
-0.13%
$8.18 B
5.79%
$0.91
10.32%
2.61%
6.47%
4.25%
0.09%
QYLD | ETF |
$17.39
+0.12%
$8.03 B
11.89%
$2.07
15.66%
3.58%
5.65%
2.02%
0.61%
JEPRX | Fund | Other
$13.94
-0.50%
$5.85 B
7.61%
$1.07
11.77%
7.72%
-
-
0.35%
DFITX | Fund | Other
$3.49
0.00%
$5.51 B
5.39%
$0.19
-1.91%
-6.66%
-2.52%
0.81%
0.27%
$28.00
+0.54%
$5.46 B
7.27%
$2.04
13.38%
0.86%
3.91%
3.99%
0.39%
FXI | ETF |
$25.44
+0.67%
$4.39 B
4.78%
$1.21
-5.54%
-16.46%
-8.39%
-0.58%
0.74%
FIWCX | Fund | Other
$9.81
-0.30%
$4.24 B
5.58%
$0.55
14.38%
5.76%
6.30%
-
0.17%
SCHC | ETF |
$34.52
-0.40%
$3.94 B
4.99%
$1.72
6.21%
-3.76%
3.51%
3.02%
0.11%
VNQI | ETF |
$40.33
-0.98%
$3.74 B
15.78%
$6.37
1.89%
-7.94%
-3.52%
0.89%
0.12%
SQQQ | ETF |
$11.81
-0.84%
$3.34 B
5.55%
$0.66
-61.44%
-38.19%
-56.76%
-52.51%
0.99%
$34.24
-0.58%
$3.21 B
4.44%
$1.52
6.17%
-1.91%
4.01%
4.31%
0.39%
FEMVX | Fund | Other
$12.63
+0.56%
$3.18 B
4.57%
$0.57
17.09%
-0.73%
-
-
0.22%
DNP | Fund | Other
$9.74
+0.83%
$3.07 B
8.01%
$0.78
-9.66%
2.67%
1.81%
6.32%
-
DIVO | Active ETF
$38.10
-0.57%
$3.06 B
4.88%
$1.86
13.02%
7.82%
11.30%
-
0.56%
XYLD | ETF |
$39.94
+0.20%
$2.86 B
10.23%
$4.08
9.95%
4.71%
4.28%
5.65%
0.60%
Get the lastest fund and ETF news in your inbox each week.
Receive latest news, trending tickers, top stocks increasing dividend this week and more.

News
Shauvik Haldar
|
Overall, major U.S. stock indices were down for the rolling month.

News
Shauvik Haldar
|
Overall, major U.S. stock indices went down for the rolling month. Precious metal...

News
Shauvik Haldar
|
Overall, some of the major U.S. stock indices marginally declined for the rolling...

News
Shauvik Haldar
|
Overall, the U.S. stock markets maintained their positive momentum for the rolling month.
Mutual Fund Education
Daniel Cross
|
While CITs and mutual funds share many similarities, there are some key differences...
Taxation
Justin Kuepper
|
Let's see why mutual funds could incur surprise taxes and how tax-managed funds...
Mutual Fund Education
Sam Bourgi
|
The phrase ‘bear market’ has been thrown around a lot lately, but it...
Portfolio Management
Check out our special report on engaging millennials through their increasing interest in...