Continue to site >
Trending ETFs

Mutual Funds and ETFs Scorecard: August 16 Edition

Every fortnight, MutualFunds.com provides a snapshot of the performance of some key mutual funds and ETFs to highlight the trending sectors, geographic regions, and asset classes. MutualFunds.com uses a system to automatically scan through thousands of relevant securities and, to ensure quality and adequate track record, places a minimum threshold on net assets ($1 billion for mutual funds and $500 million for ETFs). The best and worst performers are further discussed in the report along with key economic highlights from the past fortnight, reminding you to adjust your portfolios, if required.

Performance Scorecard
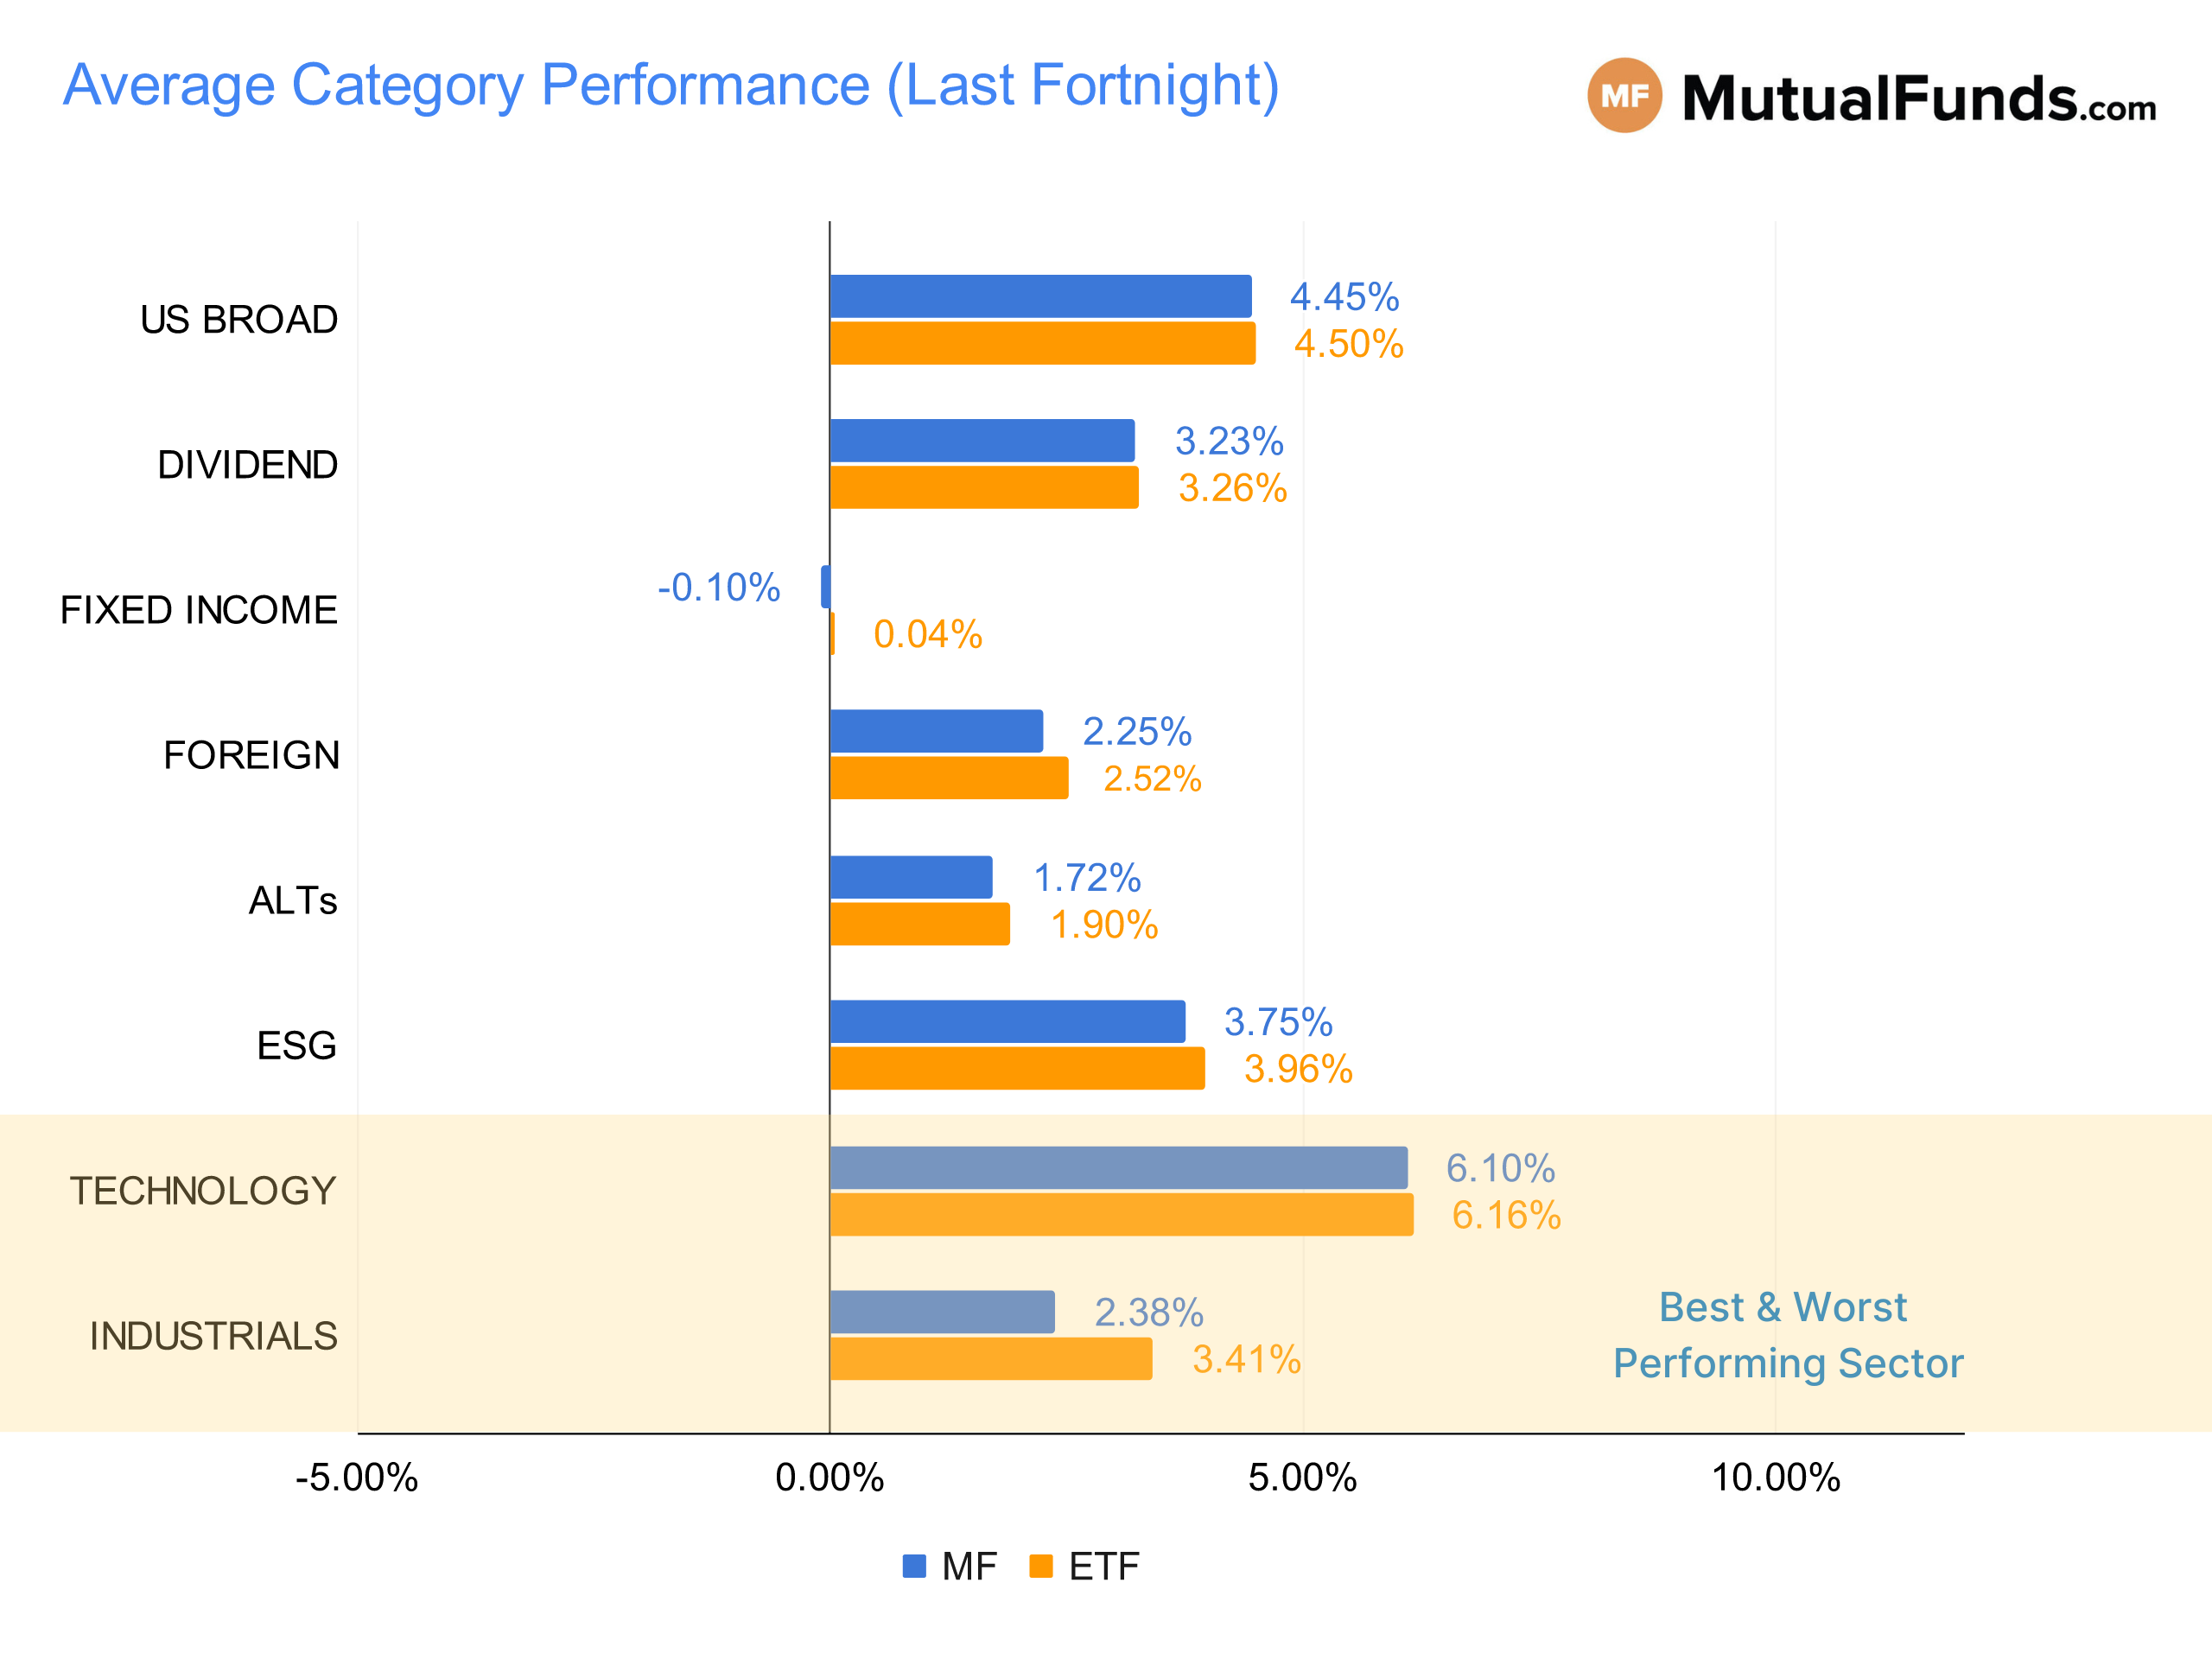
Markets have again rallied over the past two weeks, as slowing inflation has prompted bets that the Federal Reserve will stop raising interest rates sooner rather than later. However, economic indicators have continued to deteriorate, increasing the likelihood of a global recession.
MF & ETF Scorecard Graph - Category Performance - Aug 16

US Broad mostly includes funds focused on US equities and can cover different investing styles (growth/value) and market capitalizations (small/mid/large). Fixed Income includes funds focused on debt securities and can cover different geographies (US/foreign) and security types (corporate/municipal/high-yield/investment-grade/government/structured). Alternatives cover funds focused on non-traditional investment strategies (currency, hedge fund strategy, derivatives), leveraged/structured products, real estate, and commodities. Dividend funds focus on generating income via equities and not through debt.


U.S. Broad

Small-caps have performed very well over the past two weeks, with several funds among the top performers. Except for a handful of growth equity funds, other growth-focused funds have posted declines.


Top Performers


  • Mutual Funds: Morgan Stanley Institutional Fund, Inc. Growth Portfolio (MSEGX) , up 17.76%, and Virtus Zevenbergen Innovative Growth Stock Fund (SCATX), up 14.98%.
  • ETFs: iShares Micro-Cap ETF (IWC) , up 9.97%, and iShares Russell 2000 Growth ETF (IWO), up 8.04%.

Worst Performers


  • Mutual Funds: VY® T. Rowe Price Diversified Mid Cap Growth Portfolio (IAXTX) , down -23.22%, and VY® T. Rowe Price Growth Equity Portfolio (ITRGX), down -14.3%.
  • ETFs: Pacer Trendpilot™ US Large Cap ETF (PTLC) , up 0.08%, and Franklin LibertyQ U.S. Equity ETF (FLQL), up 3.03%.


Dividend

Dividend equities have posted stellar performances over the past fortnight, with practically no fund recording declines.


Top Performers


  • Mutual Funds: Vanguard Diversified Equity Fund (VDEQX) , up 5.29%, and Nuveen Dividend Value Fund (FAQIX), up 4.39%.
  • ETFs: Invesco BuyBack Achievers ETF (PKW) , up 5.09%, and Invesco S&P Ultra Dividend Revenue ETF (RDIV), up 4.79%.


Fixed Income

International and emerging market bonds have been among the top performers. Longer-term U.S. Treasuries have continued to decline, with funds shorting these long-term government bonds having outperformed.


Top Performers


  • Mutual Funds: Invesco International Bond Fund (OIBIX) , up 3.6%, and Payden Emerging Markets Bond Fund (PYEIX), up 3.58%.
  • ETFs: ProShares UltraShort 20+ Year Treasury (TBT) , up 7.46%, and iShares Convertible Bond ETF (ICVT), up 5.22%.


Worst Performers


  • Mutual Funds: PIMCO Extended Duration Fund (PEDPX) , down -4.92%, and Vanguard Extended Duration Treasury Index Fund (VEDIX), down -4.74%.
  • ETFs: iShares 20+ Year Treasury Bond ETF (TLT) , down -3.74%, and SPDR® Portfolio Long Term Treasury ETF (SPTL), down -3.45%.


Sector

Biotechnology and technology stocks have outperformed, with many posting double-digit gains over the past two weeks. At the other end of the spectrum were funds shorting technology equities, which recorded large falls.


Top Performers


  • Mutual Funds: Fidelity Advisor® Biotechnology Fund (FBTAX) , up 19.55%, and Eventide Healthcare & Life Sciences Fund (ETAHX), up 17.94%.
  • ETFs: Direxion Daily S&P Biotech Bull 3X Shares (LABU) , up 58.45%, and Direxion Daily Financial Bull 3X Shares (FAS), up 19.41%.


Worst Performers


  • Mutual Funds: Eaton Vance Worldwide Health Sciences Fund (ERHSX) , down -0.07%, and Stone Ridge High Yield Reinsurance Risk Premium Fund (SHRIX), down 0.34%.
  • ETFs: ProShares UltraPro Short QQQ (SQQQ) , down -14.04%, and iShares Expanded Tech-Software Sector ETF (IGV), down -6.74%.


Foreign

Developing world-focused funds, including Brazil, Mexico, Latin America, and Taiwan, were among the best performers. Meanwhile, funds with exposure to Russia and Japan have been the worst performers.


Top Performers


  • Mutual Funds: Lord Abbett Developing Growth Fund (LADVX) , up 8.41%, and Artisan Developing World Fund (APHYX), up 8.35%.
  • ETFs: iShares MSCI Brazil ETF (EWZ) , up 11.58%, and iShares Latin America 40 ETF (ILF), up 11.34%.


Worst Performers


  • Mutual Funds: DFA World ex U.S. Government Fixed Income Portfolio (DWFIX) , down -1.87%, and Matthews Japan Fund (MJFOX), down -0.65%.
  • ETFs: VanEck Vectors Russia ETF (RSX) , flat 0%, and JPMorgan BetaBuilders Japan ETF (BBJP), up 0.06%.


Alternatives

Volatility instruments have been hammered as the stock market rally minimized volatility. Funds focused on convertible securities outperformed while those focused on managing volatility (aka Volatility Index Futures) and mortgage-backed securities suffered.


Top Performers


  • Mutual Funds: Fidelity® Convertible Securities Fund (FICVX) , up 5.28%, and Columbia Convertible Securities Fund (COVRX), up 5.08%.
  • ETFs: ETFMG Alternative Harvest ETF (MJ) , up 8.02%, and ProShares Short VIX Short-Term Futures ETF (SVXY), up 5.57%.


Worst Performers


  • Mutual Funds: PIMCO Real Return Fund (PRRIX) , down -1.89%, and PIMCO TRENDS Managed Futures Strategy Fund (PQTIX), down -1.72%.
  • ETFs: ProShares Ultra VIX Short-Term Futures ETF (UVXY) , down -15.8%, and Janus Henderson Mortgage-Backed Securities ETF (JMBS), down -0.81%.


ESG

ESG funds have continued their rally, with most of the funds posting gains.


Top Performers


  • Mutual Funds: Brown Advisory Sustainable Growth Fund (BAFWX) , up 5.22%, and Vanguard FTSE Social Index Fund (VFTNX), up 4.63%.
  • ETFs: Xtrackers S&P 500 ESG ETF (SNPE) , up 4.15%, and iShares MSCI KLD 400 Social ETF (DSI), up 4%.


Worst Performers


  • Mutual Funds: PIMCO Total Return ESG Fund (PTGCX) , down -1.09%, and Fidelity® US Sustainability Index Fund (FITLX), up 3.7%.
  • ETFs: Xtrackers MSCI USA ESG Leaders Equity ETF (USSG) , up 3.72%, and iShares MSCI KLD 400 Social ETF (DSI), up 4%.

Key Economic Indicators

Among major economic data released during the last two weeks, U.S. inflation slowed to 8.5% in July from 9% in the prior month, thanks to declining oil prices.

U.S. unemployment claims have been rising steadily since April, but remain at very low levels. Indeed, the U.S. reported another blockbuster jobs report, with the number of employed people jumping 528,000 in July, more than half what analysts had predicted. Average hourly earnings grew by a strong 0.5%, while the unemployment rate fell from 3.6% to 3.5%.

U.S. manufacturing PMI has declined less than expected, from 53 to 52.8, and is still at levels showing expansion. However, the index reached a low not seen since July 2020.

Amid accelerating inflation, the Bank of England raised interest rates from 1.25% to 1.75%. Meanwhile, the U.K.’s economic output fell 0.1% in the second quarter compared to the prior three-month period. Eurozone manufacturing PMI is in recession at 49.8, however, the U.K.’s manufacturing PMI is holding up better at 52.1. In services PMI, the picture was a little different. The Eurozone and the U.K. remain in expansion territory, while the U.S. ISM Services PMI surged from 55.3 to 56.7.

In Asia, China’s Caixin manufacturing purchasing managers’ index (PMI) has declined from 51.7 to 50.4, very close to levels indicating contraction.

Fund performance data is calculated for period between July 29 and August 12.


Sign up for Advisor Access

Receive email updates about best performers, news, CE accredited webcasts and more.

Popular Articles

Read Next

Mutual Funds and ETFs Scorecard: August 16 Edition

Every fortnight, MutualFunds.com provides a snapshot of the performance of some key mutual funds and ETFs to highlight the trending sectors, geographic regions, and asset classes. MutualFunds.com uses a system to automatically scan through thousands of relevant securities and, to ensure quality and adequate track record, places a minimum threshold on net assets ($1 billion for mutual funds and $500 million for ETFs). The best and worst performers are further discussed in the report along with key economic highlights from the past fortnight, reminding you to adjust your portfolios, if required.

Performance Scorecard

Markets have again rallied over the past two weeks, as slowing inflation has prompted bets that the Federal Reserve will stop raising interest rates sooner rather than later. However, economic indicators have continued to deteriorate, increasing the likelihood of a global recession.
MF & ETF Scorecard Graph - Category Performance - Aug 16

US Broad mostly includes funds focused on US equities and can cover different investing styles (growth/value) and market capitalizations (small/mid/large). Fixed Income includes funds focused on debt securities and can cover different geographies (US/foreign) and security types (corporate/municipal/high-yield/investment-grade/government/structured). Alternatives cover funds focused on non-traditional investment strategies (currency, hedge fund strategy, derivatives), leveraged/structured products, real estate, and commodities. Dividend funds focus on generating income via equities and not through debt.


U.S. Broad

Small-caps have performed very well over the past two weeks, with several funds among the top performers. Except for a handful of growth equity funds, other growth-focused funds have posted declines.


Top Performers


  • Mutual Funds: Morgan Stanley Institutional Fund, Inc. Growth Portfolio (MSEGX) , up 17.76%, and Virtus Zevenbergen Innovative Growth Stock Fund (SCATX), up 14.98%.
  • ETFs: iShares Micro-Cap ETF (IWC) , up 9.97%, and iShares Russell 2000 Growth ETF (IWO), up 8.04%.

Worst Performers


  • Mutual Funds: VY® T. Rowe Price Diversified Mid Cap Growth Portfolio (IAXTX) , down -23.22%, and VY® T. Rowe Price Growth Equity Portfolio (ITRGX), down -14.3%.
  • ETFs: Pacer Trendpilot™ US Large Cap ETF (PTLC) , up 0.08%, and Franklin LibertyQ U.S. Equity ETF (FLQL), up 3.03%.


Dividend

Dividend equities have posted stellar performances over the past fortnight, with practically no fund recording declines.


Top Performers


  • Mutual Funds: Vanguard Diversified Equity Fund (VDEQX) , up 5.29%, and Nuveen Dividend Value Fund (FAQIX), up 4.39%.
  • ETFs: Invesco BuyBack Achievers ETF (PKW) , up 5.09%, and Invesco S&P Ultra Dividend Revenue ETF (RDIV), up 4.79%.


Fixed Income

International and emerging market bonds have been among the top performers. Longer-term U.S. Treasuries have continued to decline, with funds shorting these long-term government bonds having outperformed.


Top Performers


  • Mutual Funds: Invesco International Bond Fund (OIBIX) , up 3.6%, and Payden Emerging Markets Bond Fund (PYEIX), up 3.58%.
  • ETFs: ProShares UltraShort 20+ Year Treasury (TBT) , up 7.46%, and iShares Convertible Bond ETF (ICVT), up 5.22%.


Worst Performers


  • Mutual Funds: PIMCO Extended Duration Fund (PEDPX) , down -4.92%, and Vanguard Extended Duration Treasury Index Fund (VEDIX), down -4.74%.
  • ETFs: iShares 20+ Year Treasury Bond ETF (TLT) , down -3.74%, and SPDR® Portfolio Long Term Treasury ETF (SPTL), down -3.45%.


Sector

Biotechnology and technology stocks have outperformed, with many posting double-digit gains over the past two weeks. At the other end of the spectrum were funds shorting technology equities, which recorded large falls.


Top Performers


  • Mutual Funds: Fidelity Advisor® Biotechnology Fund (FBTAX) , up 19.55%, and Eventide Healthcare & Life Sciences Fund (ETAHX), up 17.94%.
  • ETFs: Direxion Daily S&P Biotech Bull 3X Shares (LABU) , up 58.45%, and Direxion Daily Financial Bull 3X Shares (FAS), up 19.41%.


Worst Performers


  • Mutual Funds: Eaton Vance Worldwide Health Sciences Fund (ERHSX) , down -0.07%, and Stone Ridge High Yield Reinsurance Risk Premium Fund (SHRIX), down 0.34%.
  • ETFs: ProShares UltraPro Short QQQ (SQQQ) , down -14.04%, and iShares Expanded Tech-Software Sector ETF (IGV), down -6.74%.


Foreign

Developing world-focused funds, including Brazil, Mexico, Latin America, and Taiwan, were among the best performers. Meanwhile, funds with exposure to Russia and Japan have been the worst performers.


Top Performers


  • Mutual Funds: Lord Abbett Developing Growth Fund (LADVX) , up 8.41%, and Artisan Developing World Fund (APHYX), up 8.35%.
  • ETFs: iShares MSCI Brazil ETF (EWZ) , up 11.58%, and iShares Latin America 40 ETF (ILF), up 11.34%.


Worst Performers


  • Mutual Funds: DFA World ex U.S. Government Fixed Income Portfolio (DWFIX) , down -1.87%, and Matthews Japan Fund (MJFOX), down -0.65%.
  • ETFs: VanEck Vectors Russia ETF (RSX) , flat 0%, and JPMorgan BetaBuilders Japan ETF (BBJP), up 0.06%.


Alternatives

Volatility instruments have been hammered as the stock market rally minimized volatility. Funds focused on convertible securities outperformed while those focused on managing volatility (aka Volatility Index Futures) and mortgage-backed securities suffered.


Top Performers


  • Mutual Funds: Fidelity® Convertible Securities Fund (FICVX) , up 5.28%, and Columbia Convertible Securities Fund (COVRX), up 5.08%.
  • ETFs: ETFMG Alternative Harvest ETF (MJ) , up 8.02%, and ProShares Short VIX Short-Term Futures ETF (SVXY), up 5.57%.


Worst Performers


  • Mutual Funds: PIMCO Real Return Fund (PRRIX) , down -1.89%, and PIMCO TRENDS Managed Futures Strategy Fund (PQTIX), down -1.72%.
  • ETFs: ProShares Ultra VIX Short-Term Futures ETF (UVXY) , down -15.8%, and Janus Henderson Mortgage-Backed Securities ETF (JMBS), down -0.81%.


ESG

ESG funds have continued their rally, with most of the funds posting gains.


Top Performers


  • Mutual Funds: Brown Advisory Sustainable Growth Fund (BAFWX) , up 5.22%, and Vanguard FTSE Social Index Fund (VFTNX), up 4.63%.
  • ETFs: Xtrackers S&P 500 ESG ETF (SNPE) , up 4.15%, and iShares MSCI KLD 400 Social ETF (DSI), up 4%.


Worst Performers


  • Mutual Funds: PIMCO Total Return ESG Fund (PTGCX) , down -1.09%, and Fidelity® US Sustainability Index Fund (FITLX), up 3.7%.
  • ETFs: Xtrackers MSCI USA ESG Leaders Equity ETF (USSG) , up 3.72%, and iShares MSCI KLD 400 Social ETF (DSI), up 4%.

Key Economic Indicators

Among major economic data released during the last two weeks, U.S. inflation slowed to 8.5% in July from 9% in the prior month, thanks to declining oil prices.

U.S. unemployment claims have been rising steadily since April, but remain at very low levels. Indeed, the U.S. reported another blockbuster jobs report, with the number of employed people jumping 528,000 in July, more than half what analysts had predicted. Average hourly earnings grew by a strong 0.5%, while the unemployment rate fell from 3.6% to 3.5%.

U.S. manufacturing PMI has declined less than expected, from 53 to 52.8, and is still at levels showing expansion. However, the index reached a low not seen since July 2020.

Amid accelerating inflation, the Bank of England raised interest rates from 1.25% to 1.75%. Meanwhile, the U.K.’s economic output fell 0.1% in the second quarter compared to the prior three-month period. Eurozone manufacturing PMI is in recession at 49.8, however, the U.K.’s manufacturing PMI is holding up better at 52.1. In services PMI, the picture was a little different. The Eurozone and the U.K. remain in expansion territory, while the U.S. ISM Services PMI surged from 55.3 to 56.7.

In Asia, China’s Caixin manufacturing purchasing managers’ index (PMI) has declined from 51.7 to 50.4, very close to levels indicating contraction.

Fund performance data is calculated for period between July 29 and August 12.


Sign up for Advisor Access

Receive email updates about best performers, news, CE accredited webcasts and more.

Popular Articles

Read Next