Positive labor market trends, lower inflation expectations, and the potential for a Fed pause propelled stocks to officially hit a new bull market, producing gains across the major indices. The surging stock market was helped by rallying T-bills, with 3- and 6-month yields dipping at the Treasury’s recent auction. Economic data was overall light and mixed. The ISM Services PMI showed the fifth consecutive month of expansion in May. However, the reading of 50.3 was barely above expansionary levels and below April’s reading of 51.9. Meanwhile, the U.S. trade deficit widened to a six-month high in April, with exports declining by 3.6% – the most since April 2020. On the commodities front, a series of inventory and storage data from the Energy Information Administration (EIA) showed build-ups of several key energy commodities such as gasoline and heating oil.
Next week, traders will once again focus on inflation data with the release of the latest consumer and producer price index readings. The consumer price index came in at 4.9% in April 2023, the lowest rate since April of 2021 and underscoring how the Fed’s path of rate hikes is working to cool-off the economy. On Tuesday, analysts now expect consumer prices to further drop to just 4.3% for May. Core inflation, which excludes volatile food and energy categories, is also expected to dip lower. Producers are also expected to get a break on inflationary pressures as well, with May’s PPI reading on Wednesday expected to follow the 10-month downward trend and come in at 2.1%, lower than April’s reading of 2.3%. All of that data will coincide with the latest Fed decision on interest rates. Fed officials have expressed uncertainty about the future rate of tightening. On Wednesday, analysts are predicting that the Fed will pause, keeping rates at 5.25%. However, there is still a chance that the Fed could conduct another 0.25% hike. Investors will be keen to hear what Chairman Powell has to say during his press conference after the meeting. Finally, on Thursday retail sales figures for May will be released and are expected to marginally increase by 0.2% month-over-month, reflecting a slightly better environment for consumers.
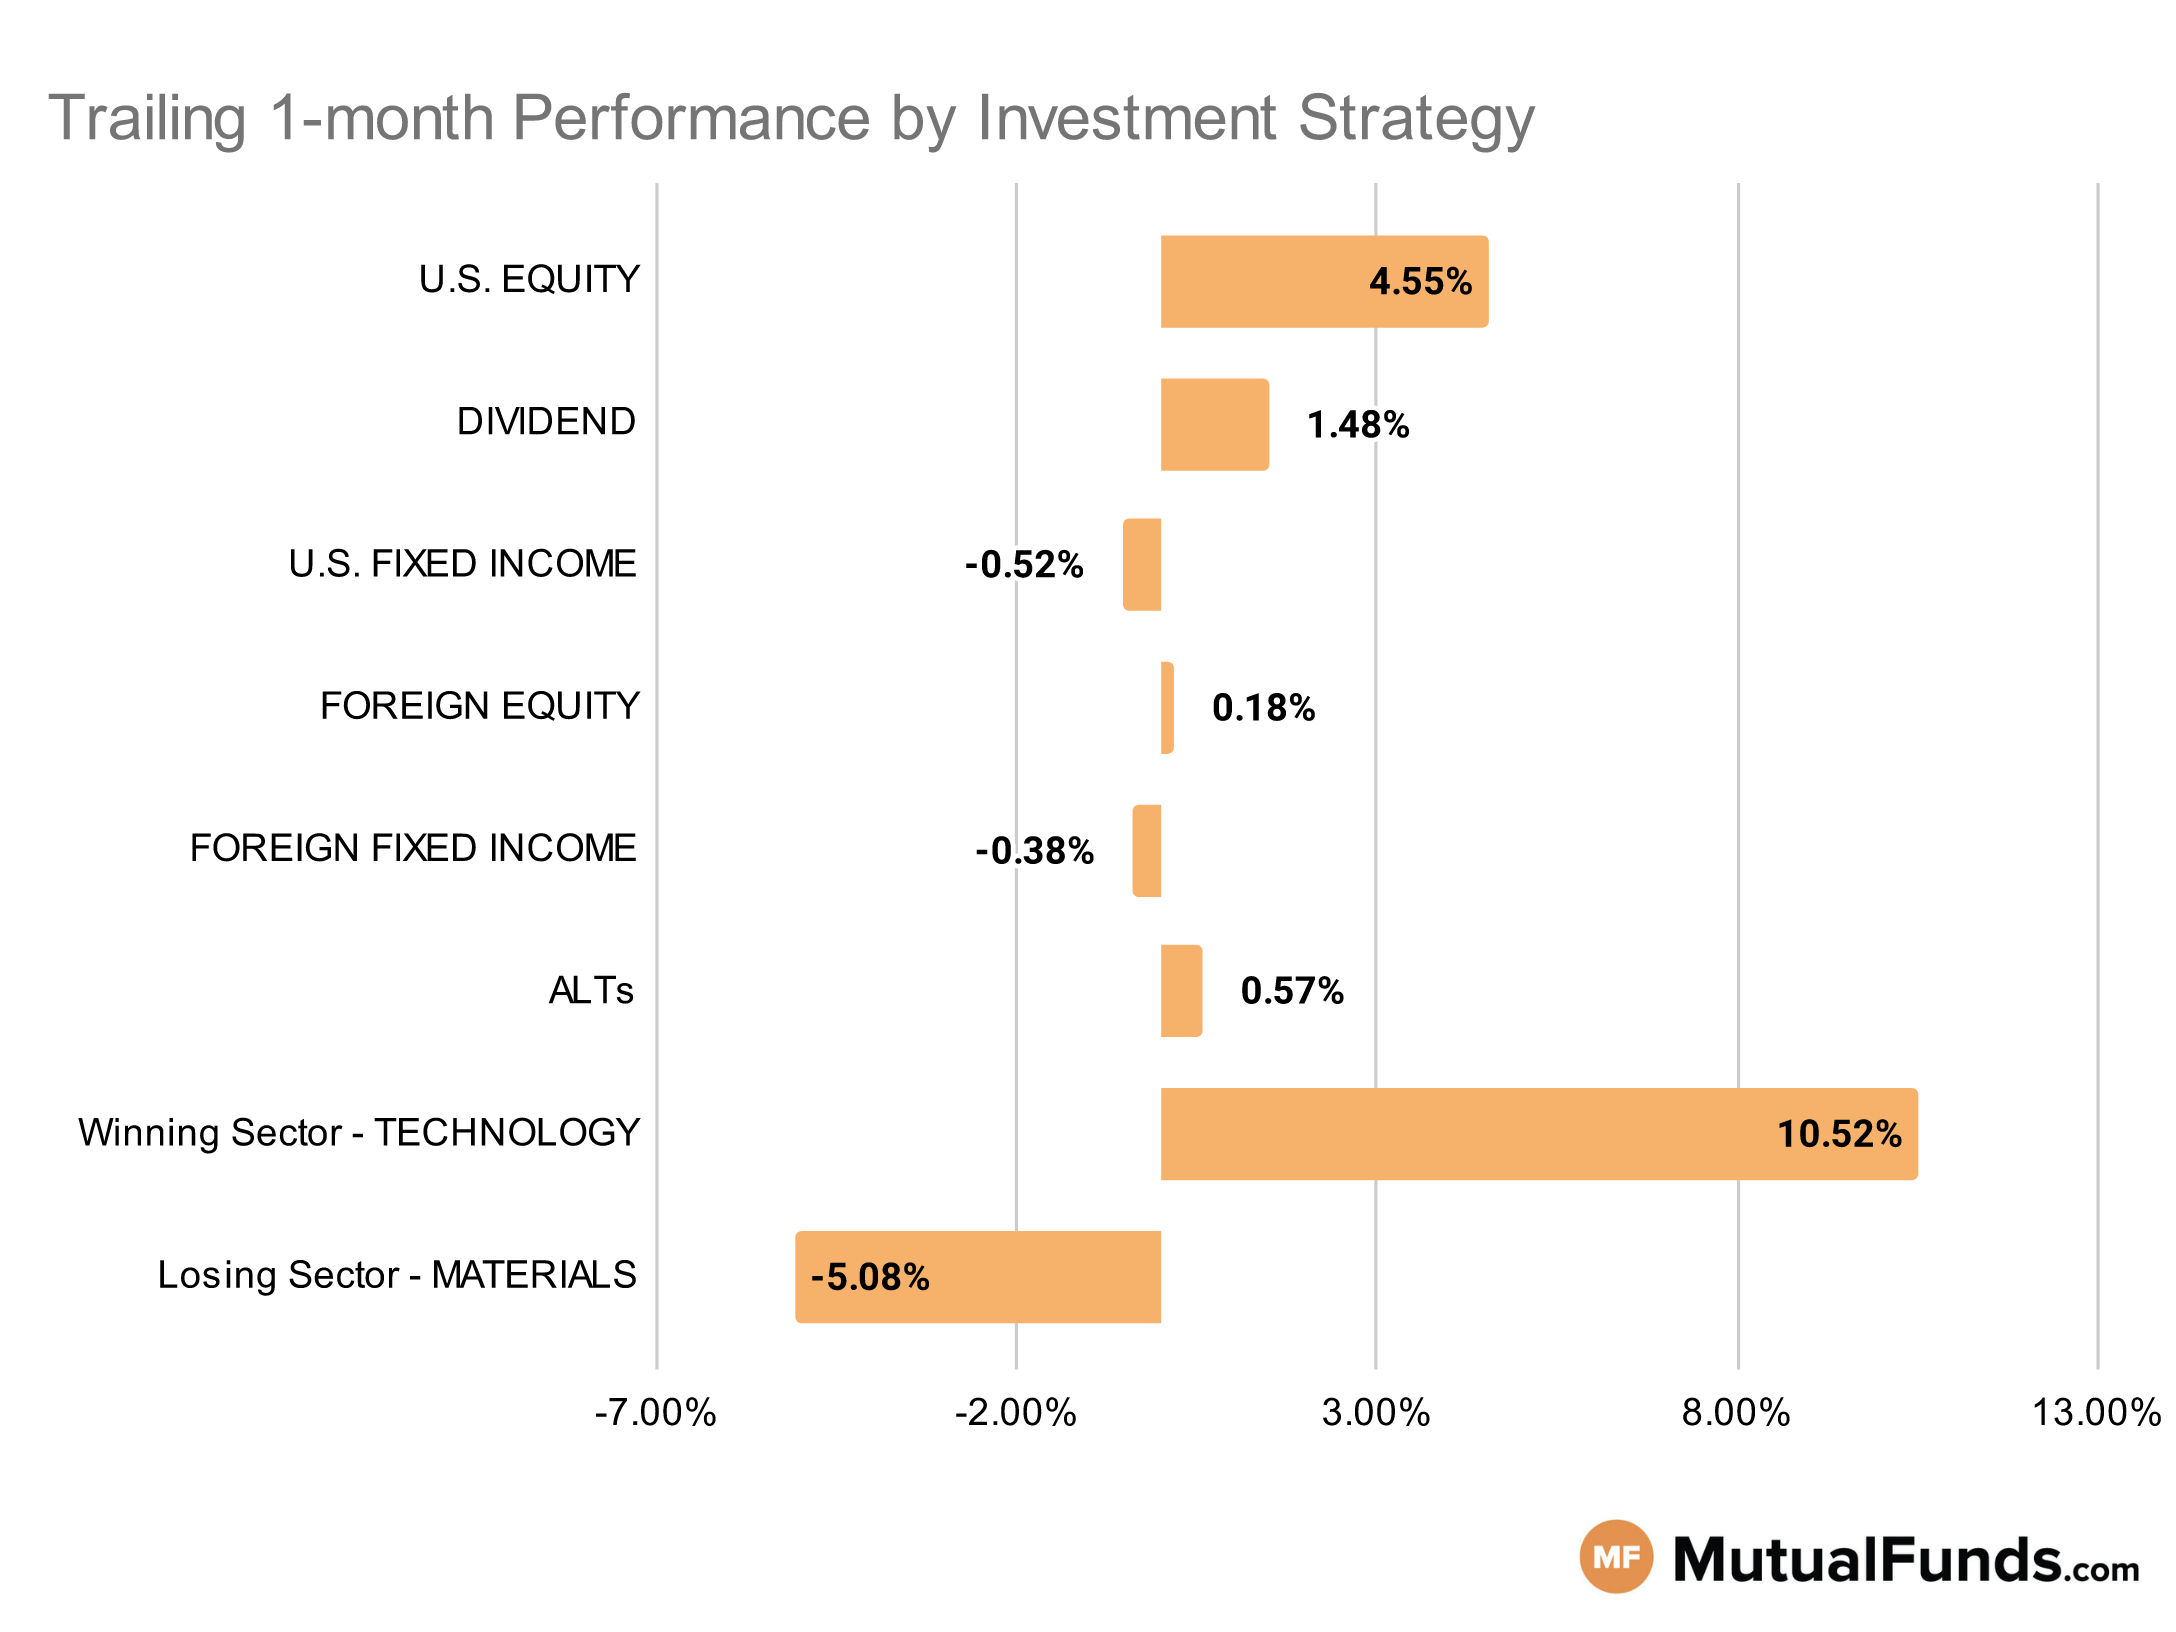
Given this economic backdrop, let us see how this impacts the performance of various investment strategies.
Investment Strategy Scorecard
U.S Equity Strategies
In U.S. equities, growth strategies outperformed others over the last trailing month. On the other hand, mid and larger cap focused strategies struggled.
Winning
- Spyglass Growth Fund (SPYGX) , up 13.98%
- Virtus Zevenbergen Innovative Growth Stock Fund (SCATX), up 11.21%
- iShares Micro-Cap ETF (IWC) , up 8.86%
- Fidelity® Nasdaq Composite Index® ETF (ONEQ), up 8.63%
Losing
- iShares Russell Mid-Cap Value ETF (IWS) , down 2.29%
- Schwab U.S. Large-Cap Value ETF™ (SCHV), down 1.18%
- MFS Global Equity Fund (MWEGX) , down -1.86%
- Voya Russell Mid Cap Index Portfolio (IRMCX), down -9.08%
Dividend Strategies
When it comes to dividend income, sector based and small-cap dividend strategies won while some international and value-focussed dividend strategies lost.
Winning
- HCM Dividend Sector Plus Fund (HCMNX) , up 7.84%
- WisdomTree U.S. SmallCap Dividend Fund (DES), up 7.52%
- ProShares Russell 2000 Dividend Growers ETF (SMDV) , up 6.79%
- Principal Small-MidCap Dividend Income Fund (PMDIX), up 5.79%
Losing
- First Trust Dow Jones Global Select Dividend Index Fund (FGD) , down -1.29%
- Janus Henderson Global Equity Income Fund (HFQAX), down -1.91%
- Federated Hermes Strategic Value Dividend Fund (SVAIX) , down -1.99%
- SPDR® S&P International Dividend ETF (DWX), down -2.51%
U.S. Fixed Income Strategies
In US fixed income, strategies focused on covertible and longer duration bonds emerged as winners, while intermmediate duration treasury strategies lost.
Winning
- iShares Convertible Bond ETF (ICVT) , up 3.7%
- PIMCO StocksPLUS® Long Duration Fund (PSLDX), up 3.26%
- Miller Convertible Bond Fund (MCIFX) , up 1.57%
- ProShares Short 20+ Year Treasury (TBF), up 1.42%
Losing
- iShares Floating Rate Bond ETF (FLOT) , down -1.57%
- iShares 7-10 Year Treasury Bond ETF (IEF), down -1.69%
- T. Rowe Price U.S. Treasury Intermediate Index Fund (PRKIX) , down -2.1%
- American Funds Strategic Bond Fund (ANBFX), down -2.17%
Foreign Equity Strategies
Among foreign equity strategies, Taiwanese and South Korean equity strategies came out as the top performing strategies, while Chinese equity strategies continued with their struggles.
Winning
- iShares MSCI South Korea ETF (EWY) , up 7.67%
- iShares MSCI Taiwan ETF (EWT), up 7.29%
- Delaware Emerging Markets Fund (DEMRX) , up 5.13%
- Lord Abbett Developing Growth Fund (LADVX), up 4.87%
Losing
- Fidelity® Series Canada Fund (FCNSX) , down -2.32%
- Voya International Index Portfolio (IIIAX), down -5.55%
- Xtrackers Harvest CSI 300 China A-Shares ETF (ASHR) , down -7.58%
- KraneShares Bosera MSCI China A ETF (KBA), down -8.28%
Foreign Fixed Income Strategies
Among foreign debt, while emerging market local currency based debt strategies continue to post marginal gains, internatioal treasury strategies continued to be on the losing end.
Winning
- Stone Harbor Emerging Markets Debt Fund (SHMDX) , up 0.87%
- American Funds Emerging Markets Bond Fund (EBNFX), up 0.52%
- VanEck J.P. Morgan EM Local Currency Bond ETF (EMLC) , up 0.32%
- iShares J.P. Morgan USD Emerging Markets Bond ETF (EMB), up 0.31%
Losing
- SPDR® Bloomberg Barclays International Treasury Bond ETF (BWX) , down -1.87%
- iShares International Treasury Bond ETF (IGOV), down -1.99%
- PIMCO International Bond Fund Unhedged (PFUNX) , down -2.34%
- Janus Henderson Developed World Bond Fund (HFARX), down -2.57%
Alternatives
Among alternative strategies, low volatility and contrarian strategies came up as top performers. On the other end, gold strategies struggled.
Winning
- Invesco S&P SmallCap Low Volatility ETF (XSLV) , up 8.04%
- WisdomTree Japan Hedged Equity Fund (DXJ), up 6.44%
- Fidelity® Contrafund® Fund (FCNKX) , up 5.63%
- Janus Henderson Contrarian Fund (JCNCX), up 5.13%
Losing
- VanEck Vectors Agribusiness ETF (MOO) , down -3.25%
- PIMCO RAE Worldwide Long/Short PLUS Fund (PWLBX), down -3.35%
- ETFMG Alternative Harvest ETF (MJ) , down -10.72%
- Fidelity® Select Gold Portfolio (FSAGX), down -11.94%
Sectors
Among the various sectors, technology strategies, especially semiconductors continued to win over the last trailing month. However, precious metals (gold and palladium) strategies remained on the losing end.
Winning
- Fidelity® Select Semiconductors Portfolio (FSELX) , up 22.81%
- Fidelity Advisor® Semiconductors Fund (FIKGX), up 21.15%
- SPDR® S&P Semiconductor ETF (XSD) , up 19.97%
- VanEck Vectors Semiconductor ETF (SMH), up 18.7%
Losing
- Sprott Gold Equity Fund (SGDLX) , down -9.16%
- Franklin Gold and Precious Metals Fund (FGPMX), down -11.3%
- iShares MSCI Global Gold Miners ETF (RING) , down -11.83%
- Aberdeen Standard Physical Palladium Shares ETF (PALL), down -13.4%
Methodology
Every week, MutualFunds.com provides a snapshot of the performance of some key mutual funds and ETFs to highlight the trending investment strategies across different sectors, geographic regions, asset classes and themes. MutualFunds.com uses a proprietory system to scan through thousands of relevant mutual funds and ETFs. To ensure quality and adequate track record, the system places a minimum threshold on net assets of $100 million. Fund performance data is calculated for the trailing one month, based on change in NAV.
Here is a summary of different strategies covered in this article:
- U.S. equity strategies typically cover different equity investing styles (growth/value/blend) and market capitalizations (small/mid/large).
- Dividend strategies focus on generating income via different equity routes (high yield/dividend growth/foreign dividend/quality dividend)
- U.S. fixed income strategies focus on debt securities issued by U.S. entities and can cover different types of debt (corporate/municipal/high-yield/investment-grade/government/asset-backed) and maturity profiles (short/medium/long).
- Foreign equity strategies cover equity strategies applied to non-U.S. markets based on the level of economic growth (emerging/developed), regions (Asia/Europe/Africa), and market capitalizations (small/mid/large).
- Foreign fixed income strategies focus on debt securities issued outside the U.S. markets and can cover different regions (Asia/Europe/Africa) and regions based on the level of economic development (emerging/developed).
- Alternative strategies cover non-traditional investments (currencies, hedge funds strategies, derivatives, volatility-based), real estate, and commodities.
- Sector strategies cover dedicated exposure to various sectors of the U.S. economy including technology, healthcare, financial, and industrial among others.