
Stocks plodded along last week, following three consecutive weeks of drops for the S&P 500.
Heightened volatility and daily swings have once again become the norm with investors looking towards data and market news to help determine if the Fed will raise rates again. Also putting pressure on stocks this week was the Federal Trade Commission and 17 state attorneys general suing Amazon on antitrust grounds. This hindered the broader tech sector and major indices. Data was light on the week. Durable goods orders clocked in at a 0.2% month-over-month increase in August, reversing a sharp decline the previous month. Personal spending and income data both rose by 0.4%, matching economist expectations. Helping boost stocks on Friday initially was the Fed’s favorite inflation measure, the Core Personal Consumption Expenditures (PCE) Price Index, which only increased by 0.1%. This was below last month’s reading and below market predictions, helping investors believe that the Fed may continue to pause once again at its next FOMC meeting.
Heading into the first trading week of October, investors should remain cautious as the month is known for being one of the worst for equities. Setting potential downside off could be the plethora of important market data on the week. Starting on Monday, the ISM Manufacturing PMI, which rose to 47.6 last month, is expected to increase to 48.9. Despite an increase, the metric still shows that manufacturing activity is in the contraction phase. But the increase may add fuel to the fire for the Fed to undertake another rate hike. Also contributing to a potential rate hike could be the ISM Services PMI report on Wednesday. The metric is estimated to come in around 54 in September after unexpectedly jumping to 54.5 in August. Investors will also be keen to focus on the week’s labor market data. This includes the JOLTS Report on Tuesday, which is expected to show available jobs of 8.6 million in August compared to 8.8 million in July. On Friday, we’ll also get to see the latest unemployment rate. After hitting a decade-low of 3.5% in July, the number spiked to 3.8% for August. Thanks to the robust job market, analysts now predict the number will hover around the same level.
Given this economic backdrop, let us see how this impacts the performance of various investment strategies.
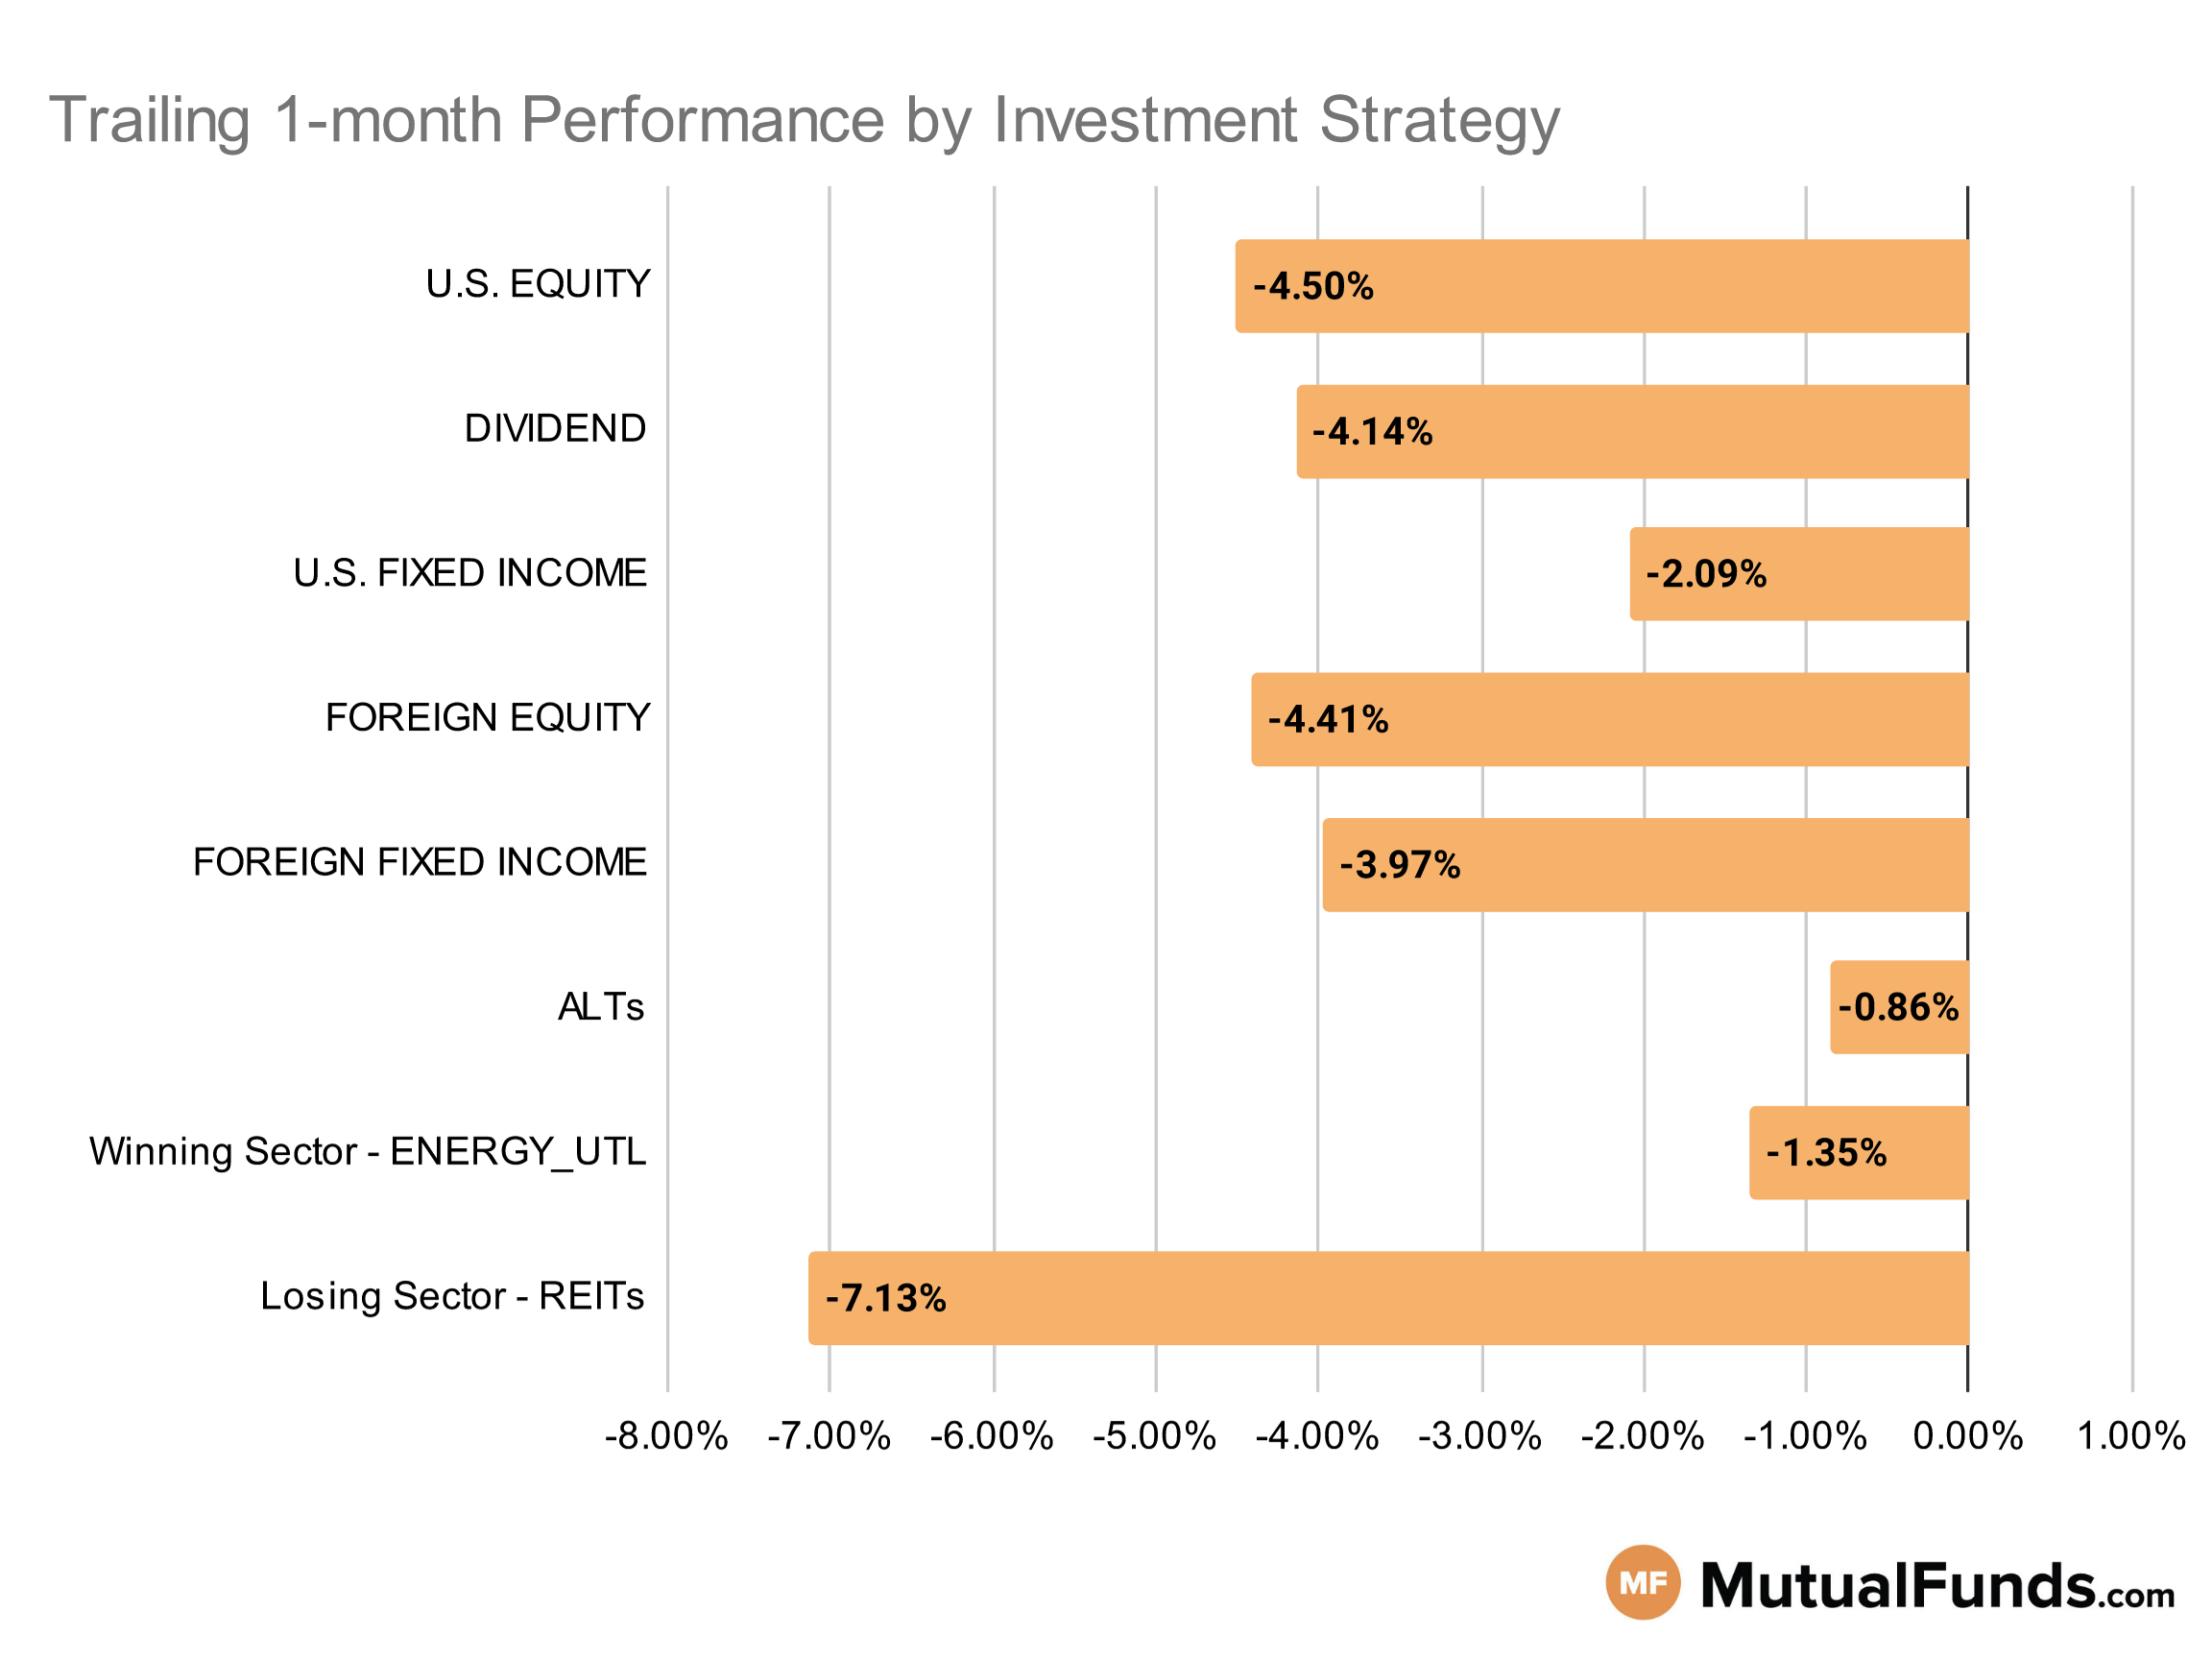
Investment Strategy Scorecard
Overall, the U.S. stock markets were down for the rolling month.
Several cannabis and energy-based strategies continue to outperform others on a rolling month basis. At the same time, strategies focused on growth and long-duration bonds struggled.
U.S Equity Strategies
None of the key U.S equity strategies posted positive performance over the trailing one month, with large-cap growth strategies struggling the most.
Losing
- BNY Mellon Dynamic Value Fund (DRGVX) , down -1.68%
- Spyglass Growth Fund (SPYGX), down -1.76%
- Schwab Fundamental U.S. Large Company Index ETF (FNDX) , down -3.6%
- First Trust US Equity Opportunities ETF (FPX), down -3.72%
- SPDR® S&P 600 Small Cap Value ETF (SLYV) , down -6.26%
- iShares Micro-Cap ETF (IWC), down -6.64%
- Allspring Premier Large Company Growth Fund (WFPDX) , down -16.8%
- Wells Fargo Premier Large Company Growth Fund (EKJAX), down -17.26%
Dividend Strategies
None of the key dividend strategies posted positive performance over the trailing one month.
Losing
- Principal Global Diversified Income Fund (PGBAX) , down -1.97%
- Thornburg Investment Income Builder Fund (TIBAX), down -2.06%
- Invesco BuyBack Achievers ETF (PKW) , down -2.6%
- WisdomTree U.S. High Dividend Fund (DHS), down -3.01%
- Principal Small-MidCap Dividend Income Fund (PMDIX) , down -5.68%
- ALPS Sector Dividend Dogs ETF (SDOG), down -6.73%
- HCM Dividend Sector Plus Fund (HCMNX) , down -6.74%
- Invesco High Yield Equity Dividend Achievers™ ETF (PEY), down -6.93%
U.S. Fixed Income Strategies
In US fixed income, floating rate strategies continue to post marginal gains over the last trailing month, with longer duration strategies struggling the most.
Winning
- ProShares Short 20+ Year Treasury (TBF) , up 7.94%
- iShares Floating Rate Bond ETF (FLOT), up 0.59%
- Franklin Floating Rate Daily Access Fund (FCFRX) , up 0.52%
- JPMorgan Strategic Income Opportunities Fund (JSOSX), up 0.26%
Losing
- SPDR® Portfolio Long Term Treasury ETF (SPTL) , down -7.34%
- iShares 20+ Year Treasury Bond ETF (TLT), down -7.92%
- PIMCO Extended Duration Fund (PEDPX) , down -11.03%
- PIMCO StocksPLUS® Long Duration Fund (PSLDX), down -11.86%
Foreign Equity Strategies
Indian equity strategies were one of the few to post positive performance over the trailing month, while international growth and Mexican equity strategies struggled.
Winning
Losing
- Fidelity® Series International Value (FINVX) , down -0.63%
- Fidelity® SAI International Value Index Fund (FIWCX), down -0.85%
- WisdomTree China ex-State-Owned Enterprises Fund (CXSE) , down -7.46%
- iShares MSCI Mexico ETF (EWW), down -8.55%
- Franklin International Growth Fund (FNGZX) , down -8.79%
- Morgan Stanley Institutional Fund, Inc. International Advantage Portfolio (MFAIX), down -9.48%
Foreign Fixed Income Strategies
None of the foreign fixed income strategies posted positive performance over the trailing one month, with emerging market debt strategies struggling the most.
Losing
- VanEck Emerging Markets High Yield Bond ETF (HYEM) , down -1.27%
- Eaton Vance Emerging Markets Debt Opportunities Fund (EIDOX), down -2.12%
- Vanguard Emerging Markets Bond Fund (VEMBX) , down -2.8%
- iShares J.P. Morgan USD Emerging Markets Bond ETF (EMB), down -3.98%
- PIMCO Emerging Markets Local Currency and Bond Fund (PELPX) , down -5.15%
- SPDR® Bloomberg Barclays Emerging Markets Local Bond ETF (EBND), down -5.22%
- VanEck J.P. Morgan EM Local Currency Bond ETF (EMLC) , down -5.86%
- Eaton Vance Emerging Markets Local Income Fund (EEIIX), down -7%
Alternatives
Among alternatives, cannabis-focused strategies performed better than gold and contrarian strategies.
Winning
- ETFMG Alternative Harvest ETF (MJ) , up 26.71%
- Catalyst/Millburn Hedge Strategy Fund (MBXAX), up 6.28%
- iShares S&P GSCI Commodity-Indexed Trust (GSG) , up 5.67%
- PIMCO TRENDS Managed Futures Strategy Fund (PQTIX), up 4.5%
Losing
- SPDR® SSGA US Large Cap Low Volatility Index ETF (LGLV) , down -4.51%
- Janus Henderson Contrarian Fund (JCNCX), down -5.1%
- VanEck Vectors Agribusiness ETF (MOO) , down -5.85%
- Fidelity® Select Gold Portfolio (FSAGX), down -9.66%
Sectors
Among the sectors, cannabis and energy focused strategies continue to outperform others by a significant margin. Clean energy and silver mining strategies struggled.
Winning
- AdvisorShares Pure US Cannabis ETF (MSOS) , up 65.77%
- Global X Uranium ETF (URA), up 17.96%
- Fidelity® Select Energy Portfolio (FSENX) , up 6.3%
- Vanguard Energy Index Fund (VENAX), up 4.4%
Losing
- Invesco Gold & Special Minerals Fund (OPGSX) , down -10.84%
- Fidelity® Real Estate Investment Portfolio (FRESX), down -12.09%
- ETFMG Prime Junior Silver Miners ETF (SILJ) , down -13.07%
- Invesco WilderHill Clean Energy ETF (PBW), down -15.07%
Methodology
Every week, MutualFunds.com provides a snapshot of the performance of some key mutual funds and ETFs to highlight the trending investment strategies across different sectors, geographic regions, asset classes and themes. MutualFunds.com uses a proprietary system to scan through thousands of relevant mutual funds and ETFs. Fund performance data is calculated for the trailing one month, based on the change in NAV.
Here is a summary of the different strategies covered in this article:
- U.S. equity strategies typically cover different equity investing styles (growth/value/blend) and market capitalizations (small/mid/large).
- Dividend strategies focus on generating income via different equity routes (high yield/dividend growth/foreign dividend/quality dividend)
- U.S. fixed income strategies focus on debt securities issued by U.S. entities and can cover different types of debt (corporate/municipal/high-yield/investment-grade/government/asset-backed) and maturity profiles (short/medium/long).
- Foreign equity strategies cover equity strategies applied to non-U.S. markets based on the level of economic growth (emerging/developed), regions (Asia/Europe/Africa), and market capitalizations (small/mid/large).
- Foreign fixed income strategies focus on debt securities issued outside the U.S. markets and can cover different regions (Asia/Europe/Africa) and regions based on the level of economic development (emerging/developed).
- Alternative strategies cover non-traditional investments (currencies, hedge funds strategies, derivatives, volatility-based), real estate, and commodities.
- Sector strategies cover dedicated exposure to various sectors of the U.S. economy including technology, healthcare, financial, and industrial among others.