In the sophisticated arena of advanced investing, understanding investor sentiment is akin to deciphering the market’s collective psyche. Traditional indicators like price-to-earnings ratios or volume trends offer historical snapshots, but options markets provide a forward-looking lens, revealing expectations about volatility, direction, and risk. Options pricing, derived from models like Black-Scholes-Merton, embeds implied assumptions about future asset behavior. By dissecting elements such as implied volatility (IV), put-call ratios, and volatility skew, seasoned investors can infer whether the crowd is bullish, bearish, or bracing for turbulence.
This article explores these tools in depth, appealing to those familiar with derivatives trading, and illustrates their application with a real-time sample from Tesla (TSLA) options data as of December 5, 2025.
Implied Volatility: The Market's Fear Gauge
Implied volatility stands as the cornerstone of sentiment analysis in options. IV represents the market’s consensus on the annualized standard deviation of the underlying asset’s returns over the option’s life, backed out from current option prices using iterative solvers in pricing models. Unlike historical volatility, which is backward-looking, IV encapsulates expectations of future uncertainty. High IV suggests investors anticipate large price swings, often signaling fear or euphoria; low IV implies complacency.
For advanced traders, IV’s value lies in its contextual interpretation. Consider the volatility smile or surface, where IV varies across strikes and maturities. A spike in at-the-money (ATM) IV across the board might indicate impending events like earnings reports or macroeconomic releases, reflecting heightened sentiment. Moreover, comparing IV to realized volatility (RV) yields the variance risk premium (VRP), where IV > RV often denotes a bearish tilt, as investors overpay for protection.
Practically, tools like the VIX index—derived from S&P 500 options—serve as a broad market sentiment barometer, dubbed the “fear index.” For individual stocks, elevated IV in calls versus puts can hint at bullish speculation, while the inverse suggests defensive positioning. Investors can track IV percentiles (e.g., current IV relative to its 52-week range) to assess if sentiment is extreme, potentially signaling contrarian opportunities.
Put-Call Ratios: Measuring Directional Bias
The put-call ratio (PCR) quantifies the balance between protective puts and speculative calls, offering a direct proxy for sentiment. Calculated from volume or open interest (OI), a high PCR (e.g., >1) implies bearish sentiment, as more puts are traded or held, indicating hedging against declines. Conversely, a low PCR (<0.7) suggests bullishness, with calls dominating.
Advanced users distinguish between volume-based PCR (short-term, flow-driven) and OI-based PCR (longer-term, positional). Volume PCR captures intraday sentiment shifts, often spiking during panic selling, while OI PCR reflects accumulated convictions. For precision, segment by moneyness: out-of-the-money (OTM) puts inflating the ratio signal tail-risk fears, whereas in-the-money (ITM) activity might indicate institutional hedging.
Consider equity options PCR from exchanges like CBOE; ratios persistently above historical averages often precede corrections. However, interpret cautiously—high put volume could stem from covered call writing (bullish) or put selling (neutral to bullish). Cross-reference with delta-adjusted metrics for a nuanced view, where put deltas (negative) amplify bearish signals.
Volatility Skew: Asymmetry in Risk Perception
Volatility skew reveals sentiment through IV disparities across strikes. In equity markets, the typical “put skew” sees higher IV for OTM puts than OTM calls, reflecting demand for downside protection—a legacy of crash fears post-1987. Measured as the difference in IV between equidistant OTM puts and calls (e.g., 25-delta put IV minus 25-delta call IV), a steep skew indicates bearish sentiment, as investors pay premiums for tail-risk hedges.
For advanced analysis, track skew indices like the CBOE Skew Index, where readings above 120 signal elevated crash concerns. Skew flattens in bull markets, as call demand rises for upside leverage. Time-varying skew, influenced by supply-demand dynamics from market makers, can predict sentiment reversals; a widening skew amid rising prices might foreshadow volatility.
Incorporate greeks for deeper insight: high put IV correlates with negative gamma for dealers, potentially exacerbating down moves. Investors can exploit skew via strategies like risk reversals (selling OTM calls, buying OTM puts) to bet on sentiment shifts.
Additional Metrics: Open Interest, Volume, and Max Pain
Beyond core indicators, open interest and volume patterns enrich sentiment analysis. High OI at specific strikes suggests “pinned” prices, as in the max pain theory—where the underlying gravitates toward the strike minimizing option payouts. Spikes in OTM call volume signal speculative fervor, while clustered put OI hints at support levels.
Integrate these with broader data: unusual options activity (large blocks) often precedes news, revealing informed sentiment. Tools like delta-neutral IV surfaces help isolate pure sentiment from directional bets.
Sample Analysis: TSLA Options on December 5, 2025
To illustrate, let’s examine TSLA options expiring December 5, 2025 (nearest term, effectively weekly), with the stock at $455.37. Data from Polygon API shows a chain with 330 contracts, focusing on strikes near ATM ($455).
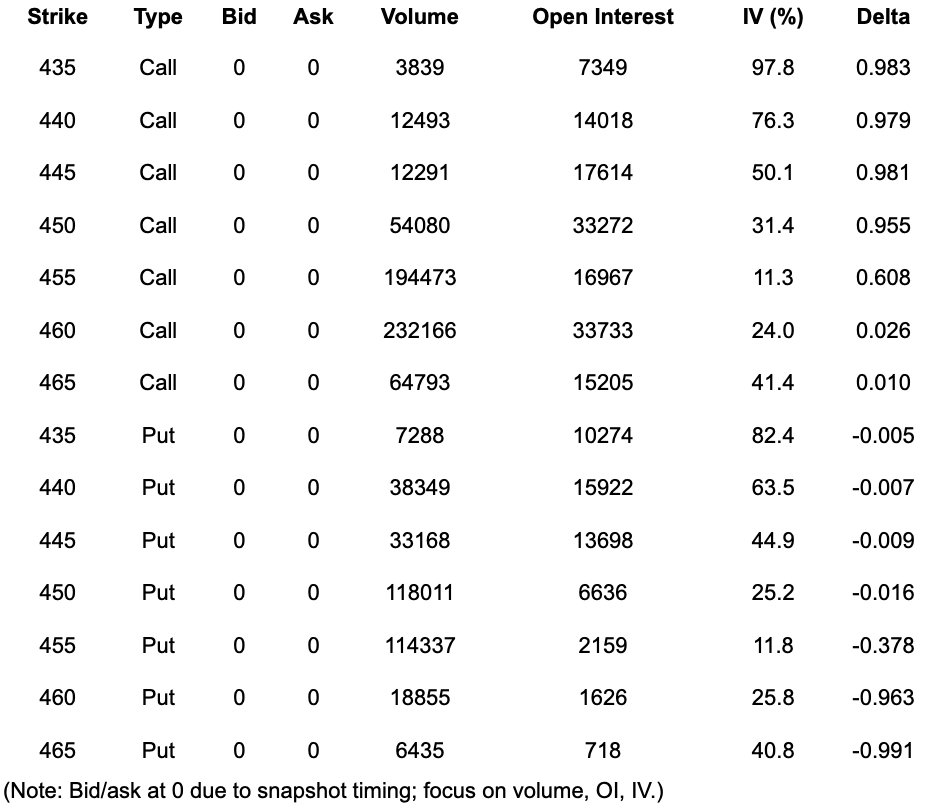
The put/call volume ratio is 0.60, below 1, suggesting bullish intraday sentiment—more call trading indicates upside bets, perhaps on TSLA’s growth narrative. However, the OI ratio of 1.41 reveals bearish undercurrents, with puts holding more positions, implying accumulated caution amid volatility.
IV analysis shows ATM call/put IV around 11-12%, low for TSLA (historical norm ~50%), signaling complacency. Yet, skew is pronounced: average OTM put IV at 478% vs. OTM call IV at 455%, a 23.8% differential. This elevated put skew highlights downside fear, possibly tied to macroeconomic risks or TSLA-specific concerns like competition. Near-ATM deltas show calls with positive bias (e.g., 455 call delta 0.61), but deep OTM puts’ high IV underscores tail protection demand.
In context, this mixed signal—bullish flow but bearish positioning and skew—might suggest a short-term rally with lurking risks. Advanced traders could monitor for skew normalization or use it to price vertical spreads favorably.
Conclusion: Integrating Options Insights into Strategy
Options pricing distills investor sentiment into actionable metrics, empowering advanced investors to anticipate shifts before they manifest in spot prices. By blending IV, PCR, and skew with quantitative models (e.g., machine learning on options data), one can construct sentiment dashboards for edge in portfolio management or trading. Remember, these are probabilistic signals—corroborate with fundamentals and macro trends. In volatile eras, mastering this art separates reactive players from prescient ones.