Many of the major trends we mentioned last quarter remain firmly in place. The U.S. economy continues to reopen, as is the case with many other countries around the world. Consumers, sitting on a glut of ~$3.5 trillion in excess savings (Source: Cornerstone Macro, WSJ Daily Shot, 6/30/21) from the pandemic restrictions and government support during the crises, have begun to spend it. Employment, despite some volatility in the data, is returning to prior levels with the most affected industries adding jobs at the fastest rate.
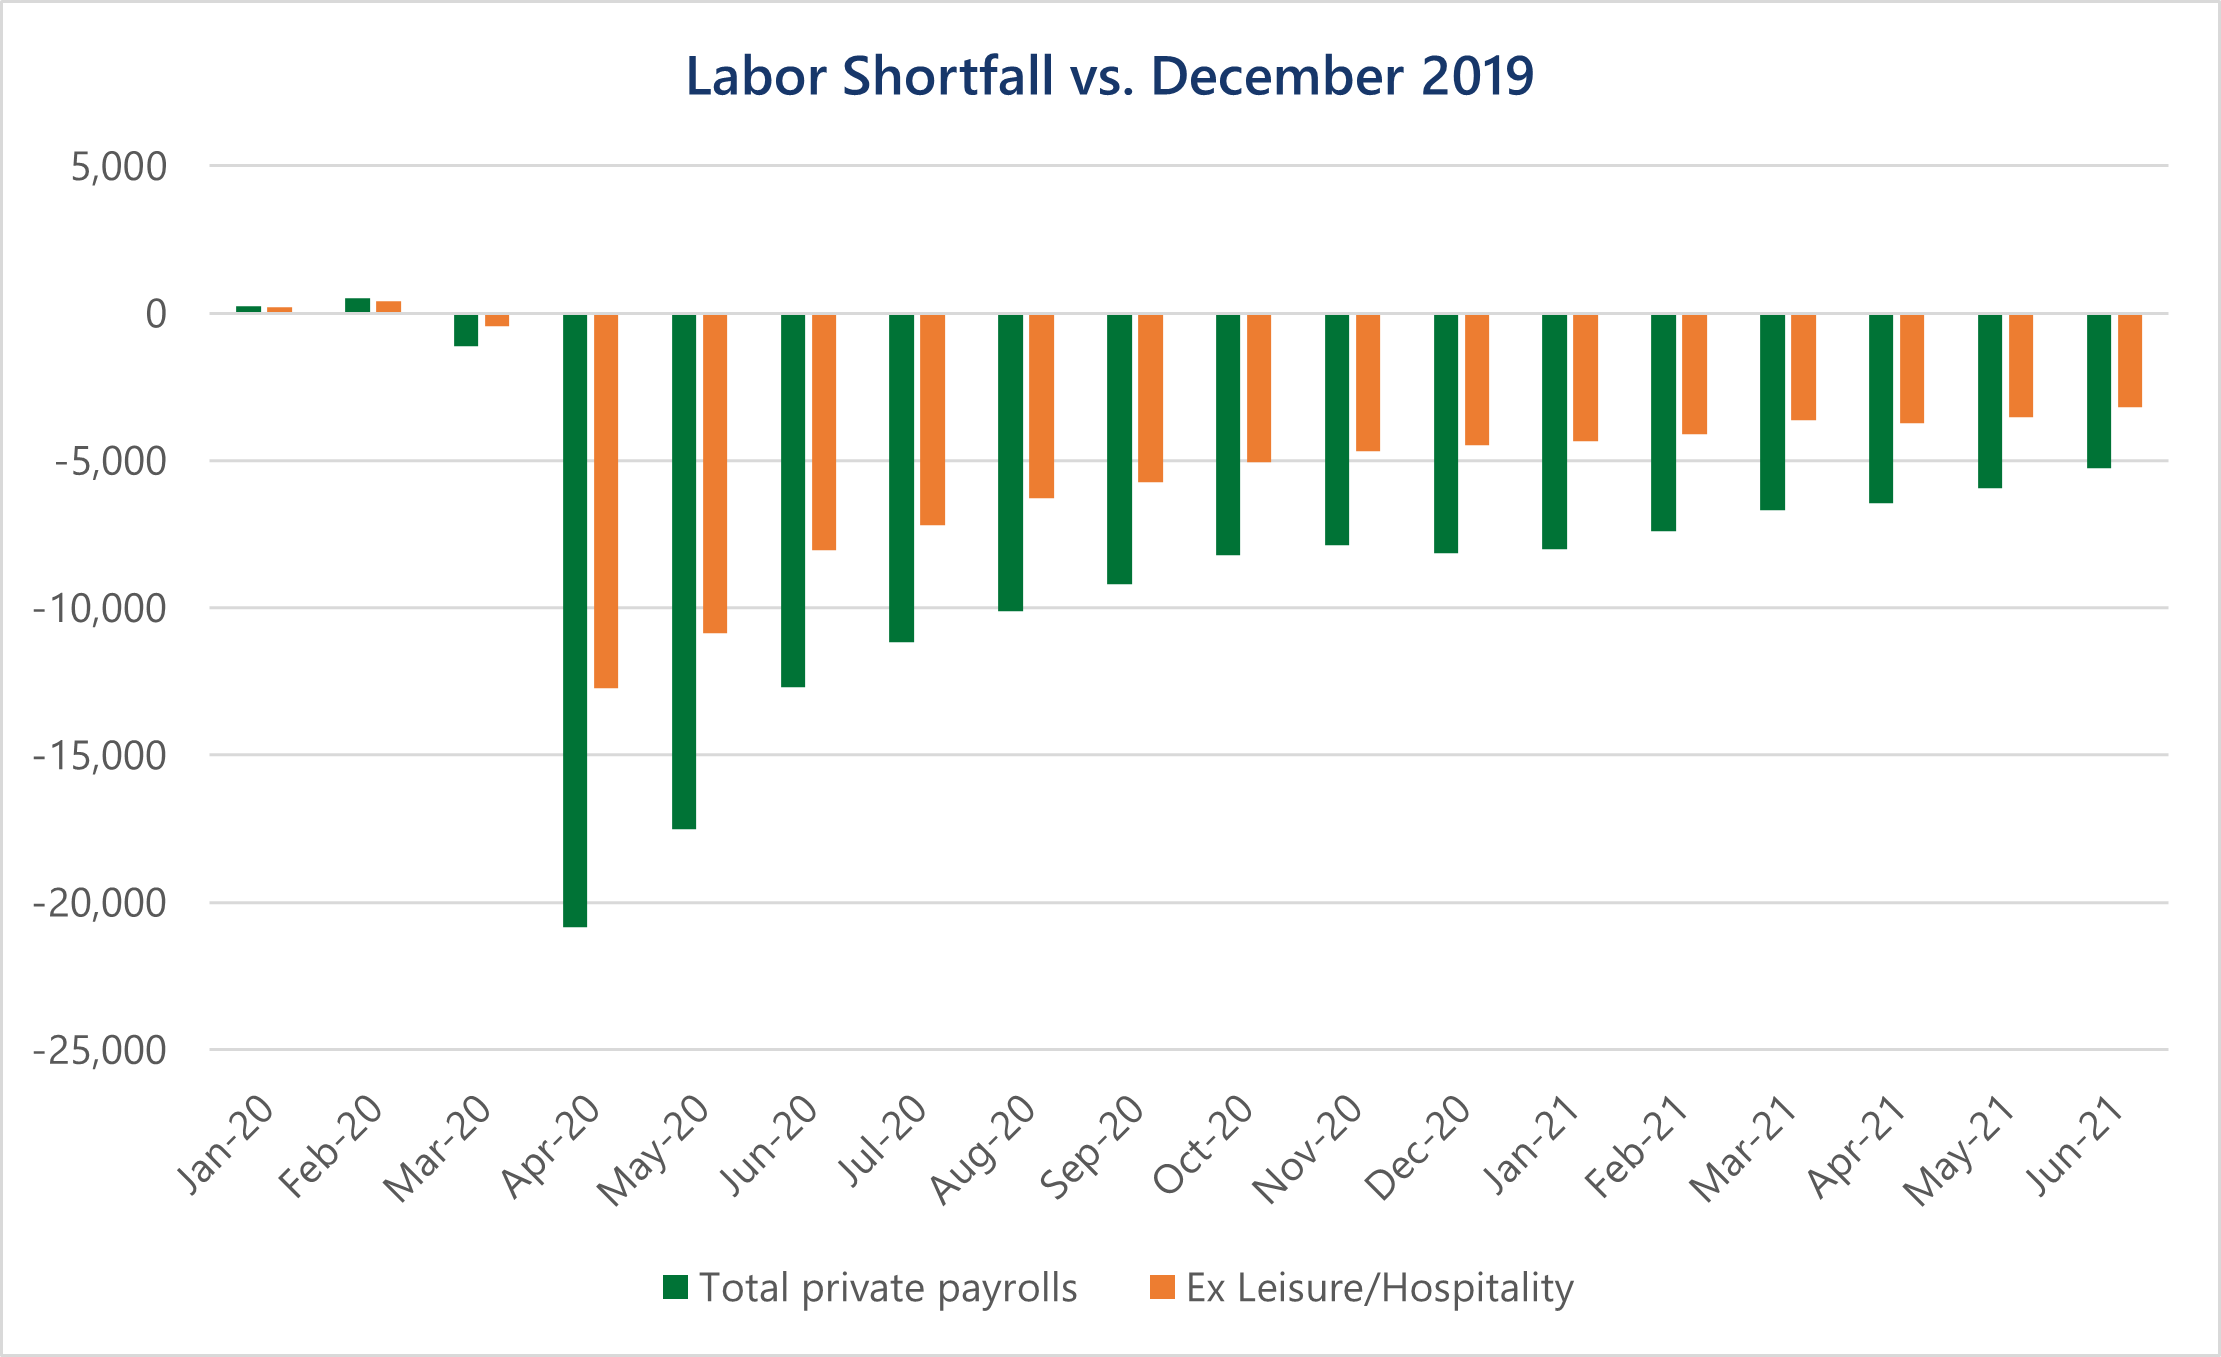
Source: U.S. Bureau of Labor Statistics, Beaumont Capital Management (BCM). Data for the period December 2019 through June 2021.
While we’ve been optimistic about the economy for some time now, we’ve also cautioned that in the short term, the equity markets are not the economy. Even though the equity markets have continued to march forward along with the economy, Q2 reinforced the idea that movements in securities markets are far less predictable than the general economy. As the quarter progressed, markets became hyper-focused on inflation and inflation expectations. This ultimately led to a change in stock market leadership, amid falling interest rates, with growth-type equities generally outperforming value-type equities. Interestingly, this period of outperformance among the type of equities that have historically benefitted from low inflation comes at a time when economists and consumers alike seem focused on the potential to overshoot on inflation. As we mentioned last quarter, the performance of value stocks relative to growth stocks has followed inflation expectations very closely. To complicate things further, market-based inflation expectations remain near recent highs, despite interest rates falling during the quarter. While there’s no reason markets must be logically consistent, we believe these price movements do tell an interesting story.
The catalyst for this change was the June Fed meeting in which the Federal Reserve seemingly acknowledged inflation could be less transitory and Chairman Powell suggested the possibility of a rate increase in 2023. Investors generally interpreted this as a more hawkish tone, causing inflation expectations and interest rates to decline following the meeting. The price movements seem to reflect a change in long-term inflation expectations more than short-term ones. The market still expects the Federal Reserve to provide a long leash in the short term, but it seems that the leash may not extend as far into the future as previously thought.
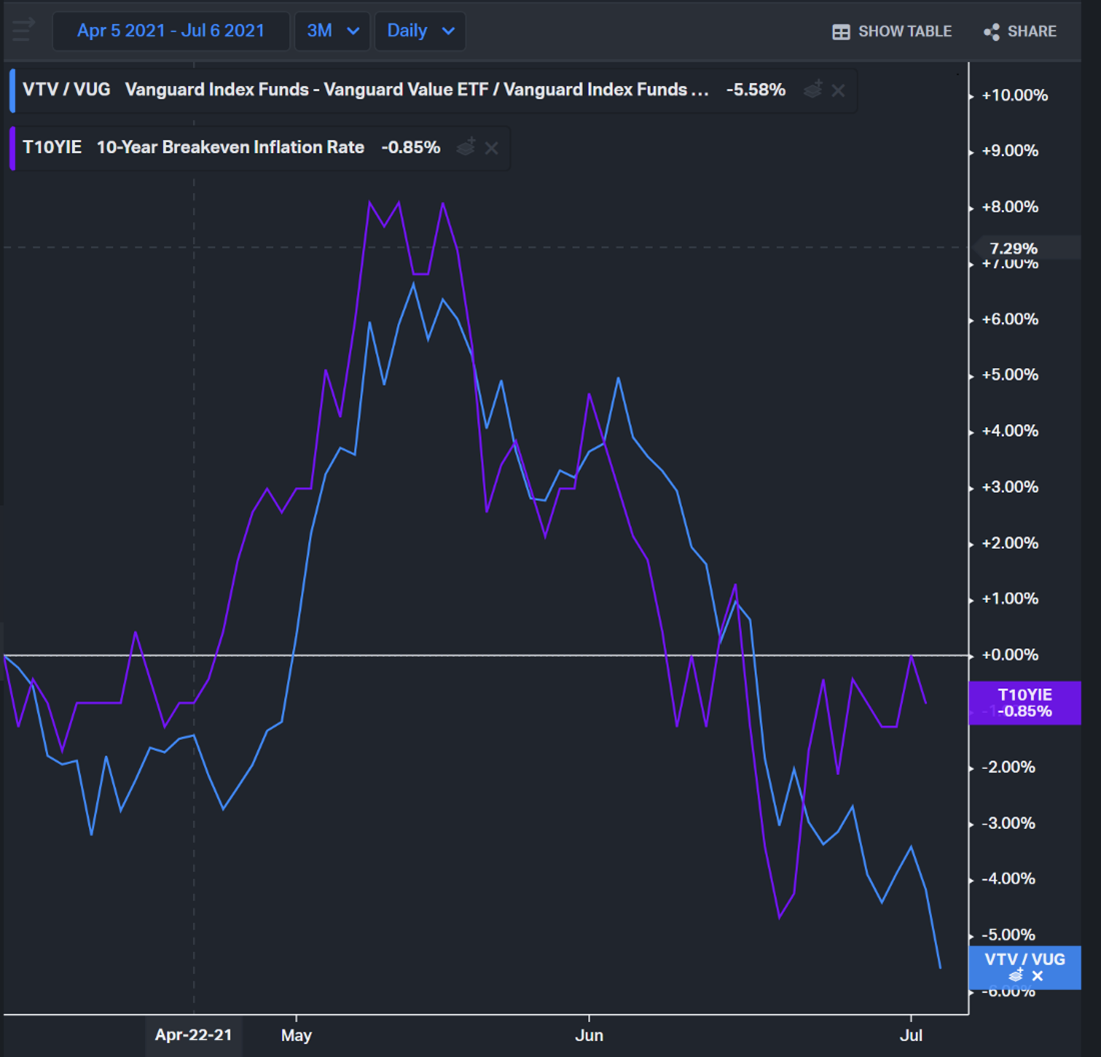
Source: Koyfin, Beaumont Capital Management (BCM). Data for the period 4/5/2021 through 7/6/2021.
The debate between how persistent inflation will be is likely to rage on for quite some time, but there is no debating that it is here and having an effect. The May CPI reading of 5% was the highest in nearly 20 years. Although there are some signs of moderation, housing prices continued to grow at some of the highest rates in history and even rents—an early victim of the pandemic—have surged past prior levels. However, housing markets have started to cool off with both builders and buyers giving pause on the backdrop of such large price increases. This type of restraint doesn’t coincide with some of the more speculative behavior we’ve seen in corners of the equity markets (meme stocks, SPACS) or in cryptocurrencies (despite some recent declines). This may imply that we haven’t reached a point of excess in the broad economy, as has been the case during past waves of stock market speculation.
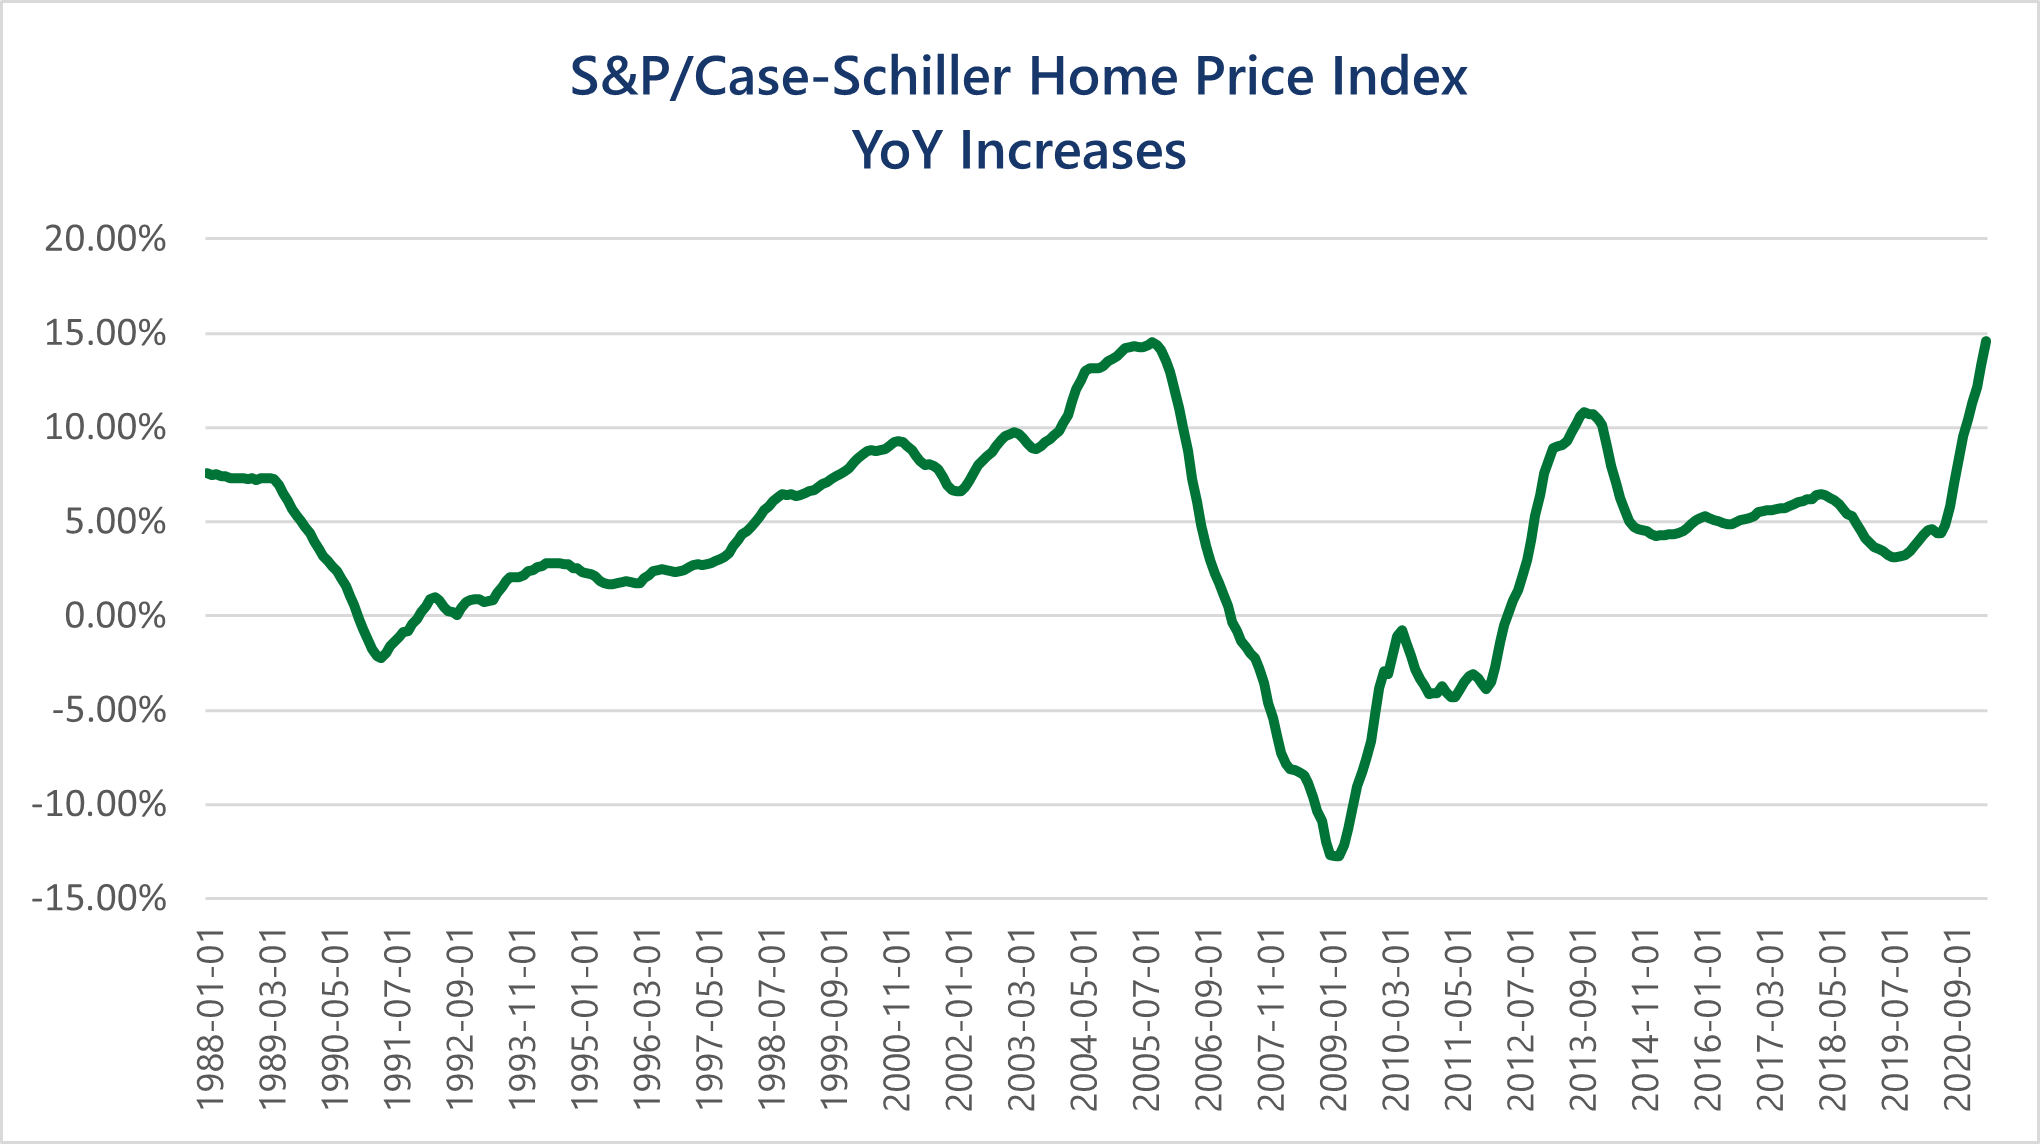
Source: Bloomberg, Beaumont Capital Management (BCM). Data for the period 1/1/1987 through 4/1/2021.
With businesses struggling to find workers—especially at the low end of the wage scale—and job openings continuing to exceed unemployment, it is not surprising that wages have outpaced general inflation thus far in the Covid recovery. This comes on the heels of a multi-decade period of relatively stagnant real wage growth, most notably at the lower end. Wages will likely be the single most relevant indicator in determining how long inflation persists. If wages increase, it puts more money in the hands of marginal consumers, which can drive spending on items that make up the inflation basket; if they don’t, inflation could simply revert to prior levels as the supply shortages from economic shutdowns wane and alleviate general pricing pressure.
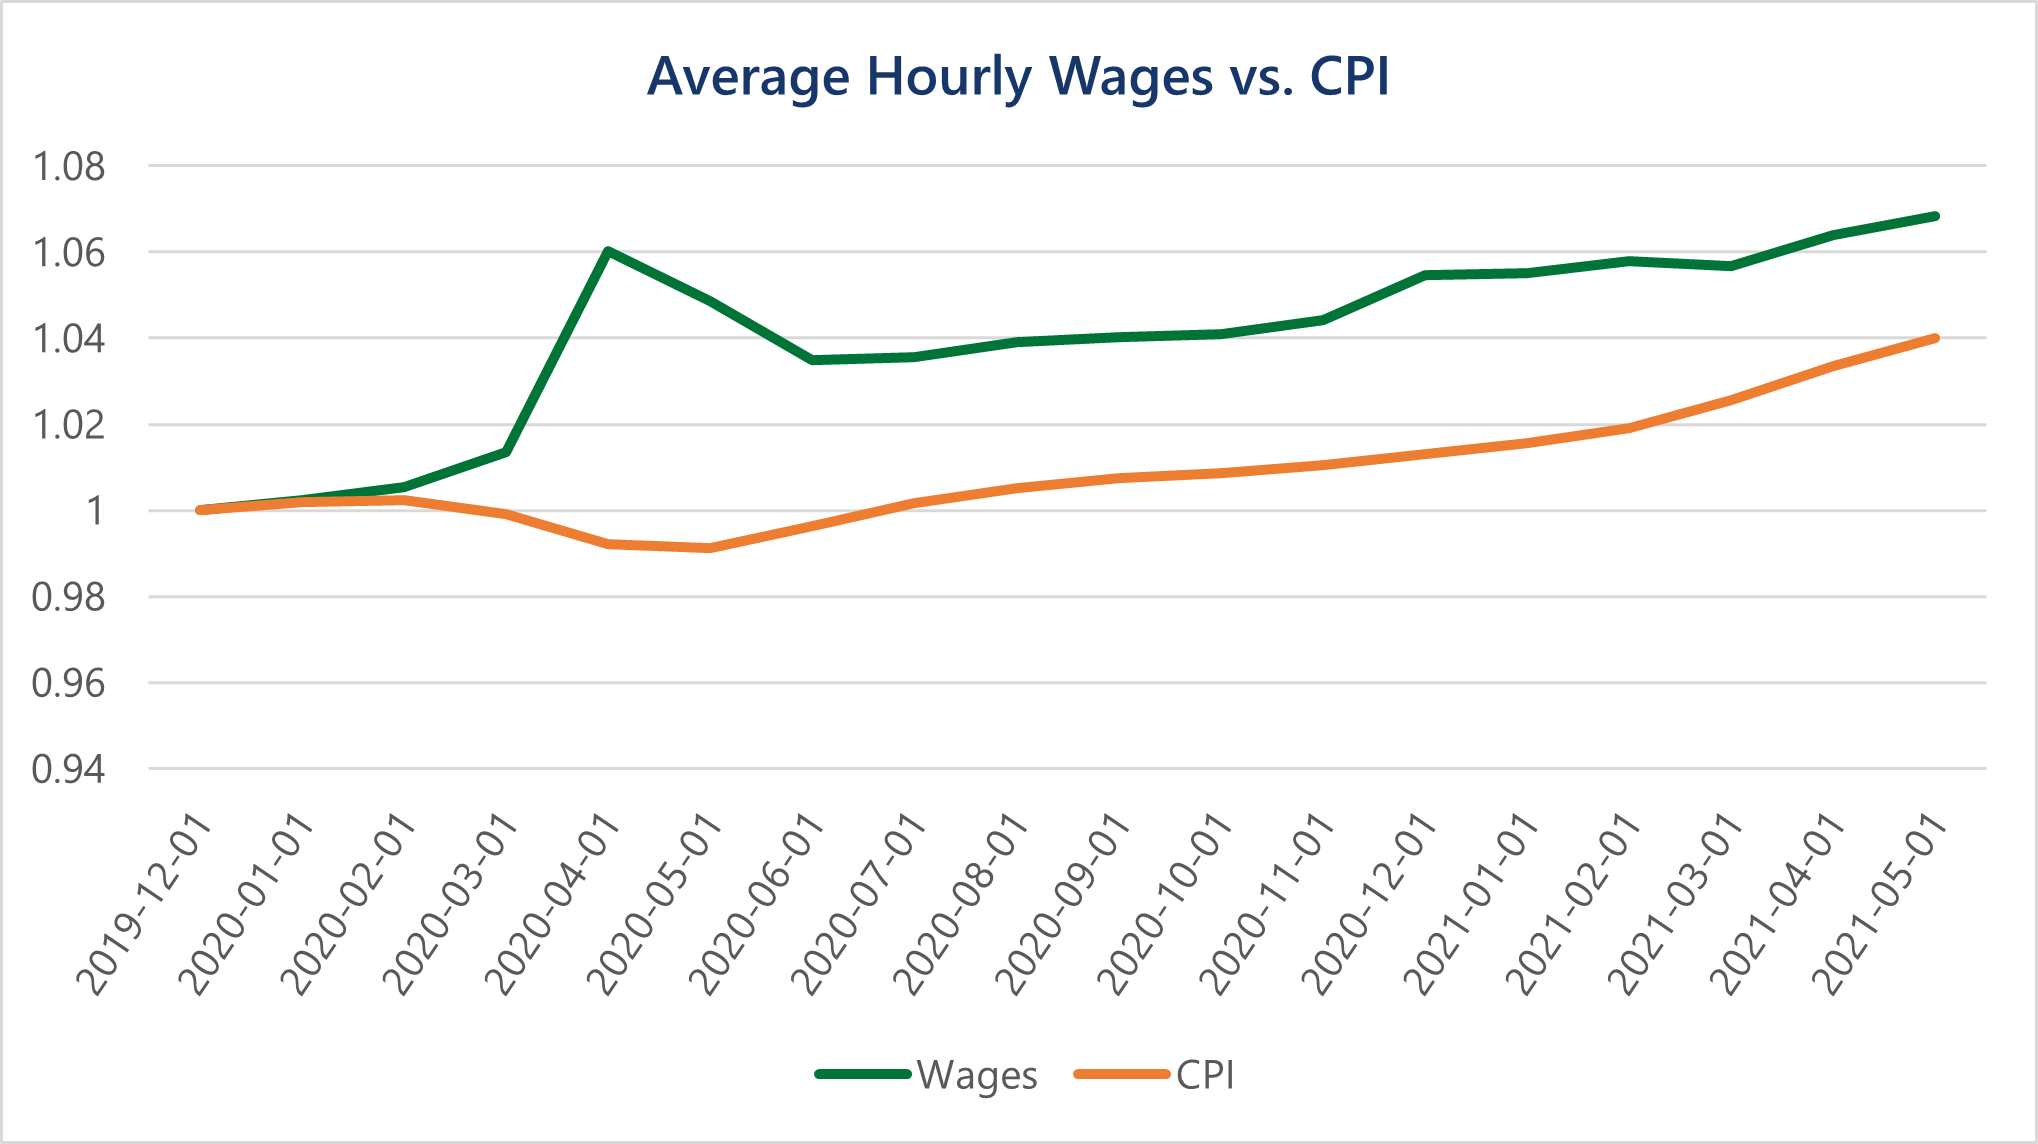
Source: Federal Reserve Bank of St. Louis. Federal Reserve Economic Data, Economic Research Division. Data for the period 6/1/2016 through 6/1/2021.
This brings us back to the idea that we contemplated in last quarter’s letter: demand-driven economics may lead to a new economic regime characterized by higher growth, rising wages, and more meaningful inflation. The prior regime was arguably created at the outset of the financial crises, which incited a strong monetary response and a lackluster fiscal response. This period was also characterized by further proliferation of the internet, which enabled nearly unlimited supply of goods, perhaps aiding in the reduction of overall prices while placing the value on finding and generating demand.
Conversely, over the past year there has been a massive fiscal response to the pandemic. In addition, Covid has forced supply restrictions across markets, driving inflation higher with a large amount of value being placed on meeting demand. Just-in-time supply chains can’t shut down for 15 months and then reopen without issues. Shortages have caused price spikes in commodities such as lumber and for finished goods like computer chips. Some of these disruptions will take months while others may take years to fully resolve. In the meantime, acute shortages of labor and goods have driven prices higher.
The tug of war between these two opposing forces has created a much different market than we’ve seen over the majority of the past decade, and whether that persists will remain the dominant focus for investors.
On the heels of historically strong recent returns across equity markets, as well as pockets of speculative behavior, one might assume investors should be extremely cautious going forward. When allocating in an uncertain future, we don’t think investors necessarily need to fear a market charging to new highs. In fact, markets making new highs often represent the safest times to invest, even if they are not necessarily the most opportunistic.
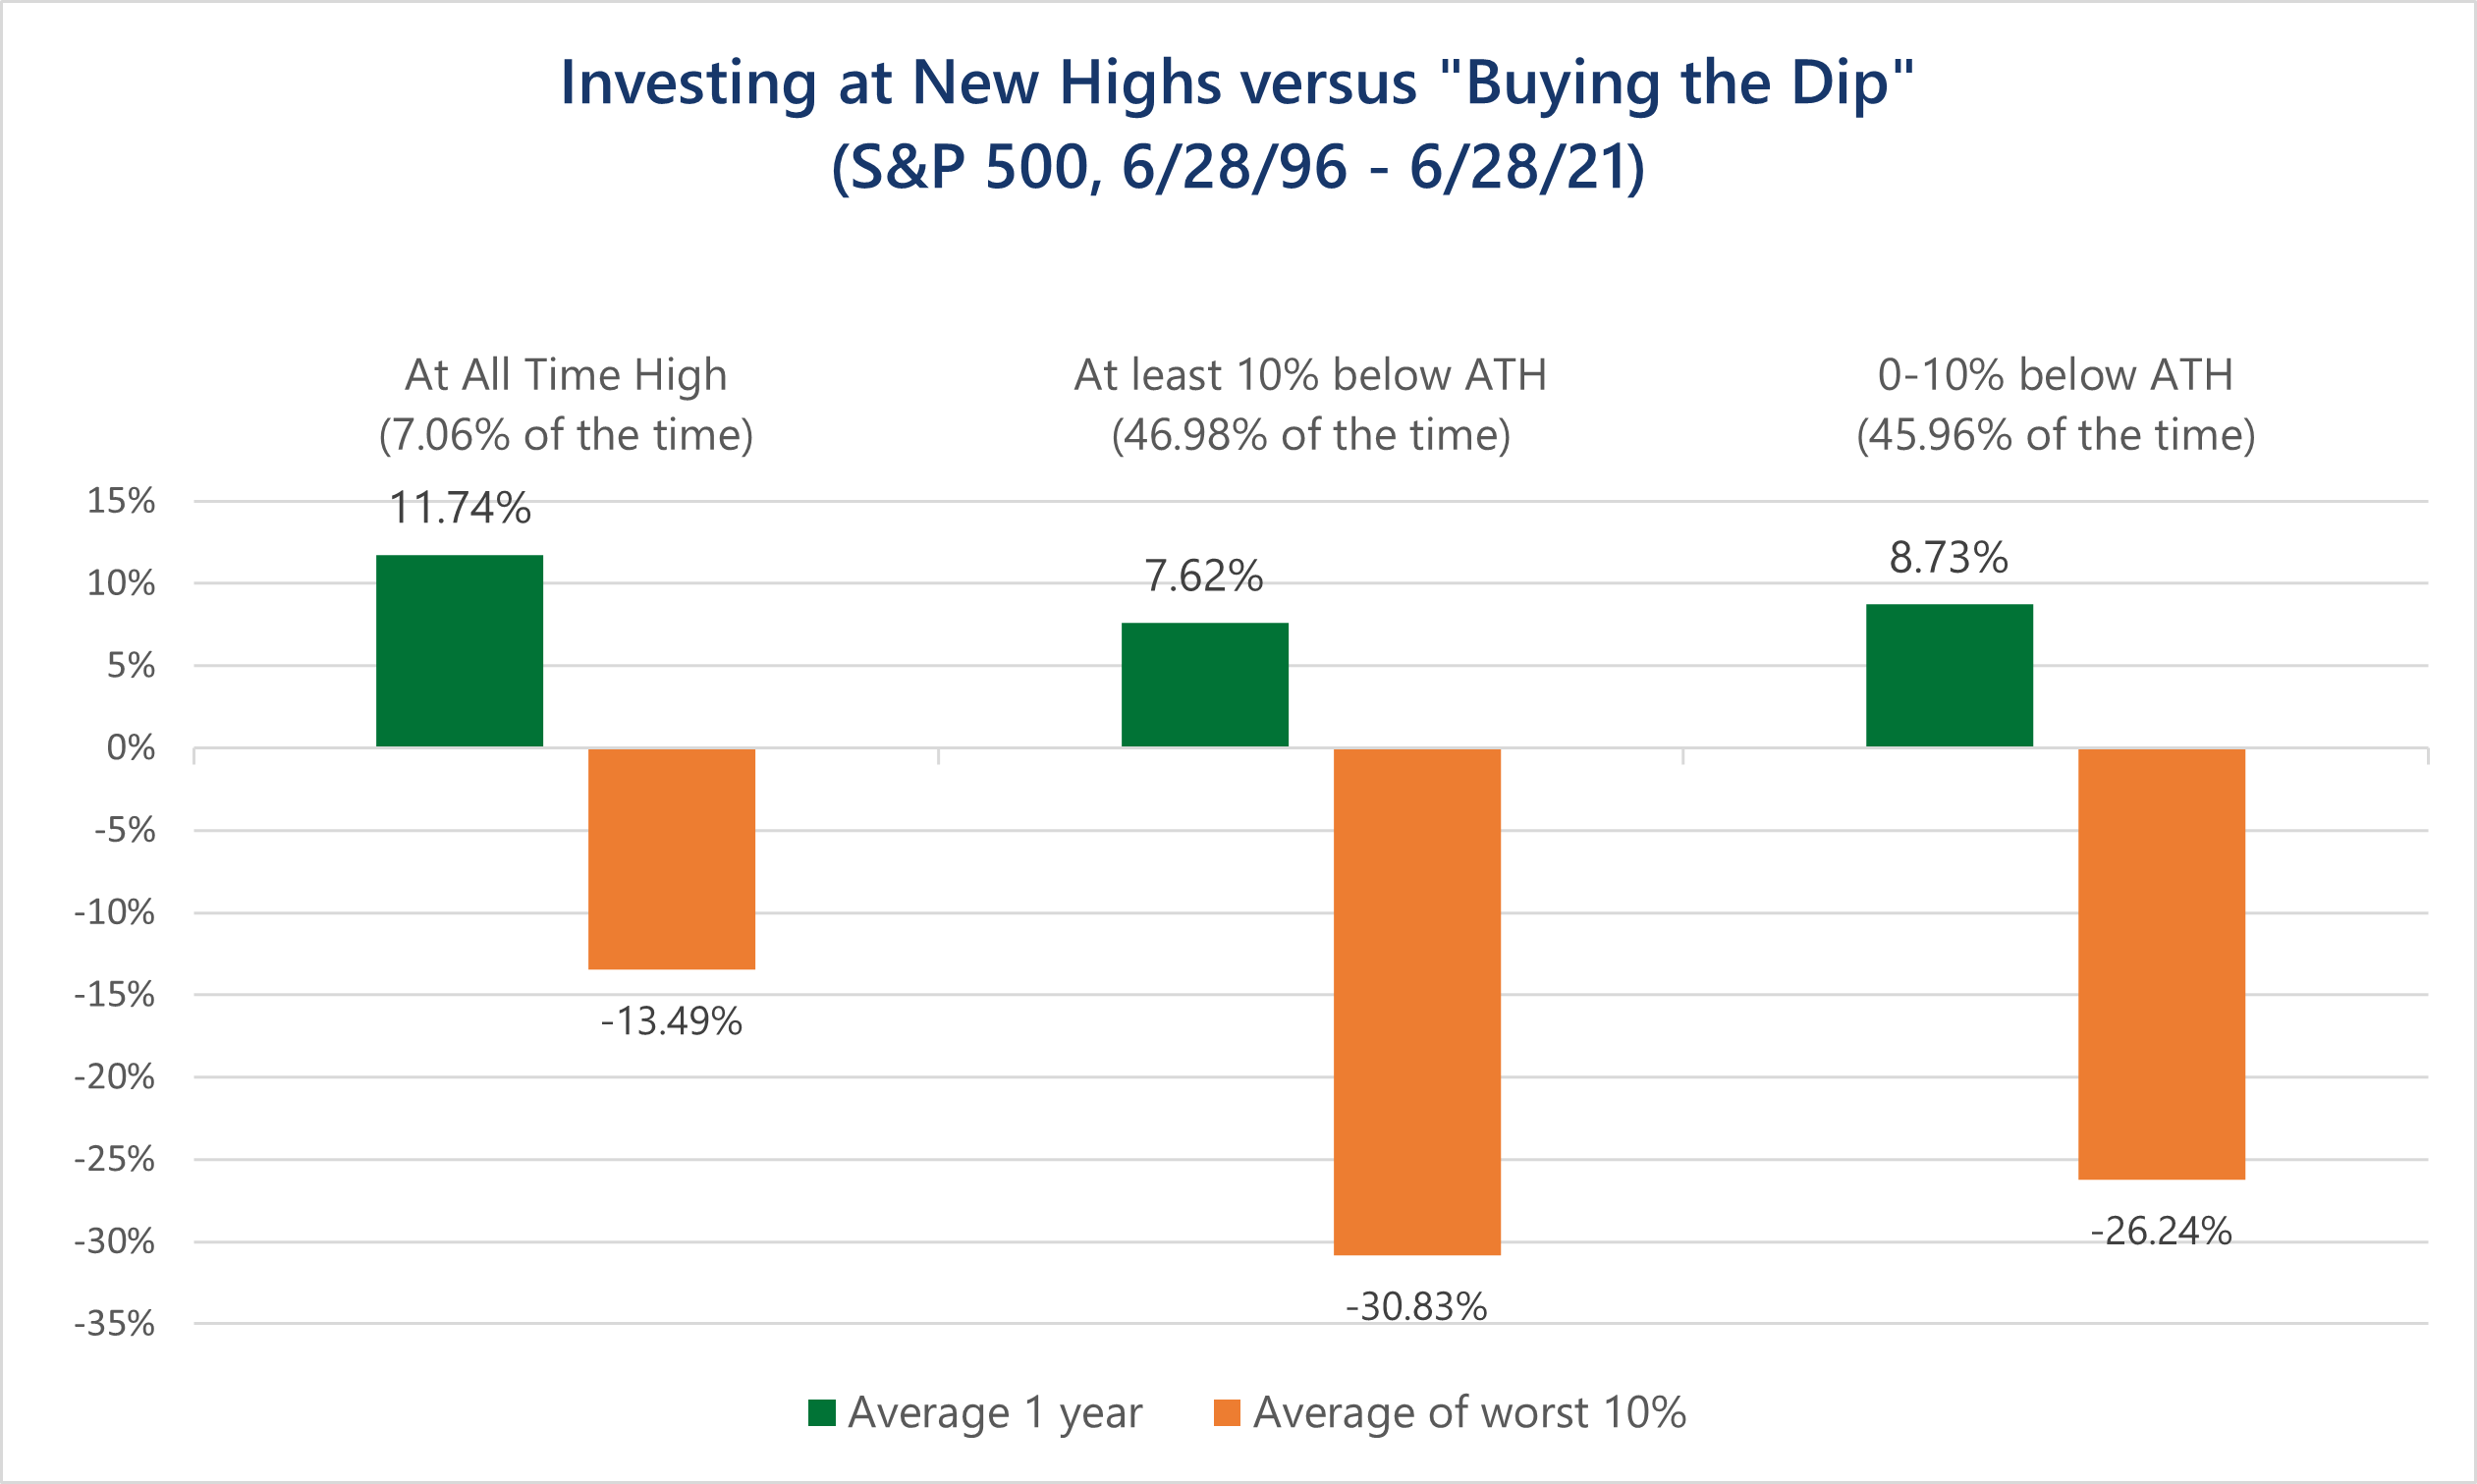
Source: Bloomberg, Beaumont Capital Management (BCM). Data for the period 6/28/1996 through 6/28/2021.
While the recovery may continue to be directionally predictable, we know that the markets will not be. The current environment may necessarily seem speculative simply because investors have less than the usual information to go off as we recover from such an anomalous event. This should continue to drive wide swings within sectors of the market even with a healthy economic backdrop. We continue to believe Decathlon’s approach is as useful as ever in this type of environment. Relative opportunities may be shorter-term and even harder to capitalize on without a systemic process, and investors can potentially benefit from strong markets while protecting against a change in trend should it occur.
Copyright © 2021 Beaumont Capital Management LLC. All rights reserved. All materials appearing in this commentary are protected by copyright as a collective work or compilation under U.S. copyright laws and are the property of Beaumont Capital Management. You may not copy, reproduce, publish, use, create derivative works, transmit, sell or in any way exploit any content, in whole or in part, in this commentary without express permission from Beaumont Capital Management.
Past performance is no guarantee of future results. Index performance is shown on a gross basis and an investment cannot be made directly in an index.
This material is provided for informational purposes only and does not in any sense constitute a solicitation or offer for the purchase or sale of a specific security or other investment options, nor does it constitute investment advice for any person. The material may contain forward or backward-looking statements regarding intent, beliefs regarding current or past expectations. The views expressed are also subject to change based on market and other conditions. The information presented in this report is based on data obtained from third party sources. Although it is believed to be accurate, no representation or warranty is made as to its accuracy or completeness.
As with all investments, there are associated inherent risks including loss of principal. Stock markets, especially foreign markets, are volatile and can decline significantly in response to adverse issuer, political, regulatory, market, or economic developments. Sector and factor investments concentrate in a particular industry or investment attribute, and the investments’ performance could depend heavily on the performance of that industry or attribute and be more volatile than the performance of less concentrated investment options and the market as a whole. Securities of companies with smaller market capitalizations tend to be more volatile and less liquid than larger company stocks. Foreign markets, particularly emerging markets, can be more volatile than U.S. markets due to increased political, regulatory, social or economic uncertainties. Fixed Income investments have exposure to credit, interest rate, market, and inflation risk.
Diversification does not ensure a profit or guarantee against a loss.
The Standard & Poor’s (S&P) 500® Index is an unmanaged index that tracks the performance of 500 widely held, large-capitalization U.S. stocks. Indices are not managed and do not incur fees or expenses. The S&P Small Cap 600® Index is an unmanaged index that tracks the performance of 600 widely held, small-capitalization U.S. stocks. The MSCI World Index is a free float-adjusted market capitalization weighted index that is designed to measure the equity market performance of developed markets. The MSCI World ex-U.S. Index is a free float-adjusted market capitalization weighted index that is designed to measure the equity market performance of developed markets, excluding the United States. The MSCI ACWI Index captures large and mid-cap representation across 23 Developed Markets and 26 Emerging Markets countries. The MSCI ACWI Index ex-U.S. captures large and mid-cap representation across 22 Developed Markets and 26 Emerging Markets countries, excluding the United States. The Bloomberg Barclay’s U.S. Aggregate Bond Index is a broad base index and is often used to represent investment grade bonds being traded in the United States.
“S&P 500®”, and “S&P Small Cap 600®” are registered trademarks of Standard & Poor’s, Inc., a division of S&P Global, Inc. MSCI® is the trademark of MSCI Inc. and/or its subsidiaries.
This article was contributed by the Beaumont Capital Management (BCM) Investment Team. For more insights like these, visit BCM’s blog here.
David M. Haviland a Managing Partner of the firm and Lead Portfolio Manager of Beaumont Capital Management (BCM). Check out his full bio here.