For nearly three decades, the 4% rule has served as the North Star of retirement planning. Introduced by financial planner William Bengen in 1994, the guideline stated that a retiree could withdraw 4% of their portfolio in the first year of retirement, adjust subsequent withdrawals annually for inflation, and have a very high probability of the money lasting at least 30 years. The beauty of the rule was its simplicity and its grounding in the worst historical sequences in U.S. markets. Yet even Bengen himself now argues that 4% is conservative, potentially too conservative, for most new retirees. In his updated research and recent book, he places the “safe” withdrawal rate between 4.5% and 5.0%, with 4.7% emerging as a new benchmark under slightly more diversified assumptions.
This upward revision is not academic quibbling; it can translate into hundreds of thousands of additional dollars of lifetime spending power. For an advanced investment audience, the real lesson is not the headline number, but how dramatically outcomes shift once we move beyond static, one-size-fits-all thinking.
Why Bengen Raised the Bar
Bengen’s original work assumed a 50/50 or 60/40 U.S. stock/bond portfolio and tested every 30-year period since 1926. The worst-case scenario (beginning in 1966) produced a safe rate of roughly 4.0-4.1%. His new analysis makes three meaningful adjustments:
- Broader diversification. Adding small-cap U.S. stocks and, to a lesser extent, international equities smooths return sequences without meaningfully increasing worst-case drawdowns.
- Slightly lower fixed-income yields in the back-test are offset by the observation that bonds have delivered positive real returns in almost every historical 30-year period.
- Longer average lifespans and a willingness to accept a 5% failure rate (instead of near-zero) push the boundary higher.
The result: a portfolio with 60-75% global equities and the balance in intermediate bonds now supports 4.7% with the same historical success rate that 4.0-4.1% delivered in the original framework.
A Live Historical Example: 2004-Present
Consider a retiree on January 30, 2004, with $1,000,000 allocated 60% to SPDR S&P 500 ETF (SPY) and 40% to iShares Core U.S. Aggregate Bond ETF (AGG). We test three inflation-adjusted withdrawal rates over the subsequent ~22 years:
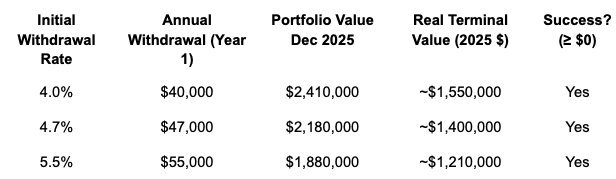
Even the aggressive 5.5% strategy left the retiree with seven figures in today’s dollars after surviving the 2008-09 crash and 2022 bear market. This single path, of course, is dangerously lucky; it began just before one of the strongest bull markets in history. The real question is what happens across thousands of plausible futures.
Monte Carlo Reality Check
Using a bootstrap simulation that resamples actual monthly returns from the same 60/40 SPY/AGG portfolio (2004-2025 data), we run 10,000 30-year retirement paths. Assumptions: withdrawals increase 2.5% annually for inflation, rebalancing yearly, 0.10% expense ratio.
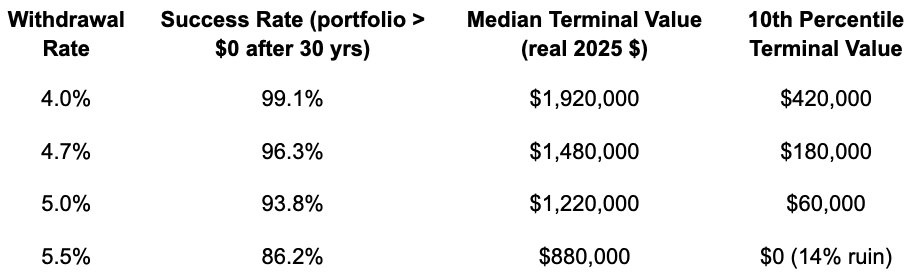
Key takeaway: Every 0.3% increase in withdrawal rate roughly doubles the probability of depletion in poor sequences. Yet for many households, a 90-95% success rate is psychologically and mathematically acceptable if it means $200,000-400,000 more lifetime spending.
Beyond the Static Rate: Dynamic Levers
Sophisticated retirees rarely adhere to a fixed percentage. Common adjustments include:
Guardrails (Guyton-Klinger rules): Reduce spending by 10% if withdrawal rate exceeds 20% above initial rate; increase if 20% below.
Variable percentage withdrawals: Withdraw a fixed percentage of the current portfolio each year (e.g., 4.5%). Spending fluctuates, but depletion risk falls to near zero.
Bucket or bond-tent strategies: Hold 5-10 years of spending in cash/fixed income, gradually increasing equity exposure over the first decade of retirement to reduce sequence risk.
Spending floors and ceilings: Guarantee essential expenses via annuities or TIPS ladders while allowing discretionary spending to float with markets.
The Bequest Motive Changes Everything
One of the least discussed variables is terminal wealth preference. Bengen’s framework implicitly assumes the retiree is comfortable dying with $0. If instead the goal is to preserve 50-100% of initial real wealth for heirs or charity, the sustainable rate drops closer to 3.5-4.0%. Conversely, households willing to accept a 10-15% chance of depletion in order to maximize lifestyle can comfortably push toward 5% or higher with dynamic rules.
Practical Implications for Today’s Retirees
Starting valuations matter enormously. CAPE ratios above 30 (as in late 2025) historically reduce safe rates by 0.5-1.0% versus periods when CAPE < 15.
Global diversification and modest small-cap/value tilts continue to add ~0.3-0.5% to safe rates with little increase in worst-case outcomes.
Fixed real withdrawal strategies are suboptimal for most; some form of dynamic spending rule almost always improves either spending or success rates.
Longevity risk is rising. A 65-year-old couple today has a material probability of one spouse reaching 95-100. Planning for 35 years rather than 30 years shaves ~0.4% off the safe rate.
Conclusion
Bill Bengen gave the industry an invaluable gift in 1994: a rigorous, data-driven starting point. His latest work reminds us that starting points are exactly that, not destinations. For knowledgeable investors and their advisors, the real value lies in stress-testing assumptions (asset allocation, inflation, longevity, spending flexibility, legacy goals) rather than memorizing a single percentage.
The 4% rule is dead; long live the 4-5% range, customized. Those who treat retirement withdrawal planning as an ongoing, adaptive process rather than a set-it-and-forget-it calculation will extract dramatically more utility from their lifetime savings. In an era of higher valuations, lower expected returns, and longer lifespans, that adaptability is not optional; it is the new margin of safety.