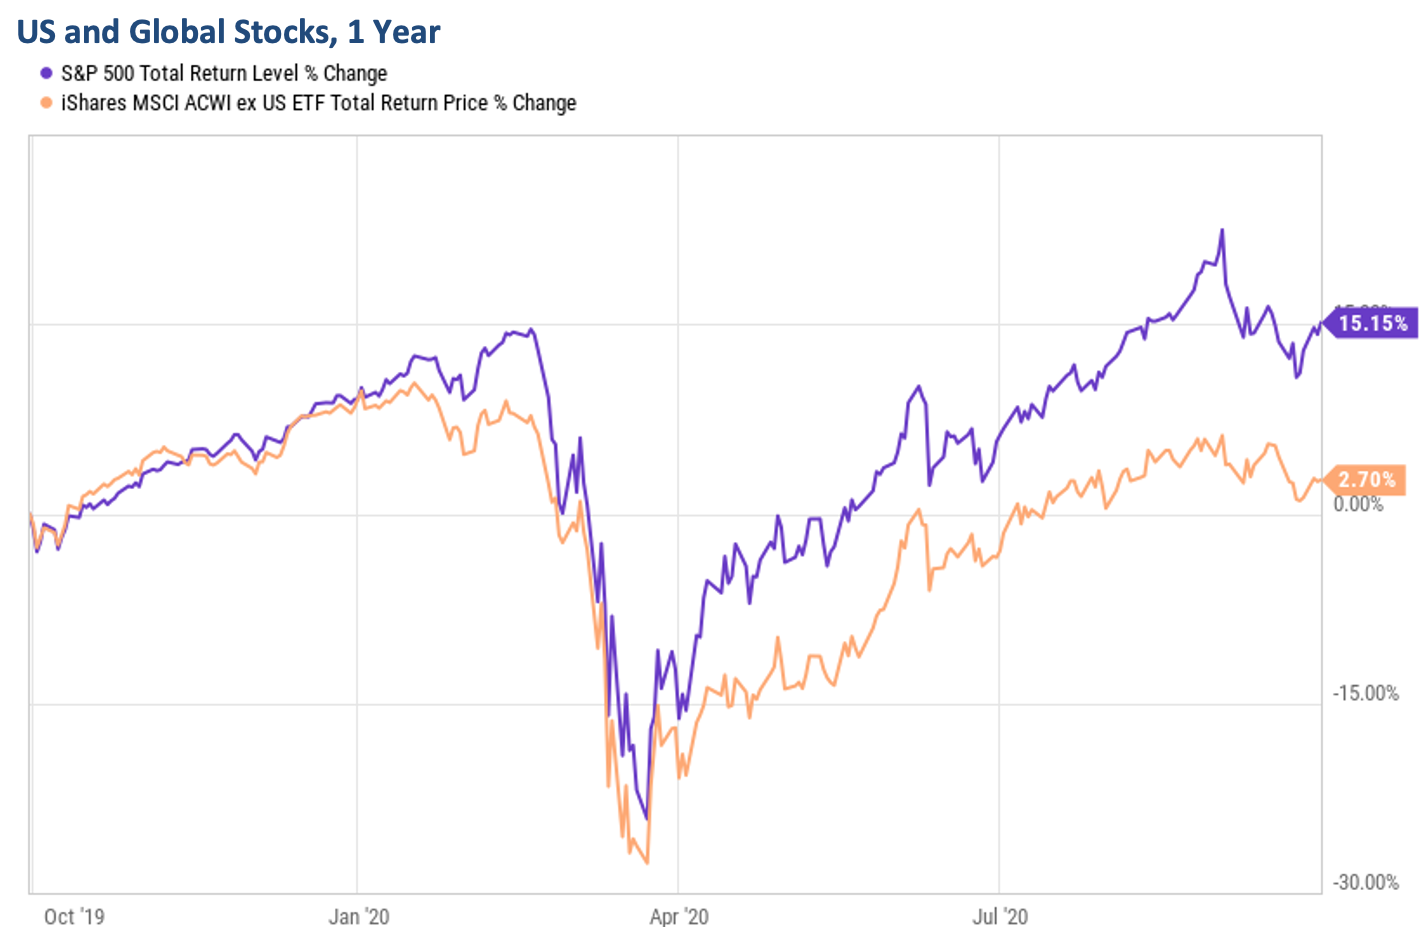
• Market volatility increased in September and might continue into the election.
• Our equity model’s 6m forecast for the S&P 500 has improved but remains negative.
• Our short-term risk model continues to give a Sell signal. Both models dictate defensive positioning.

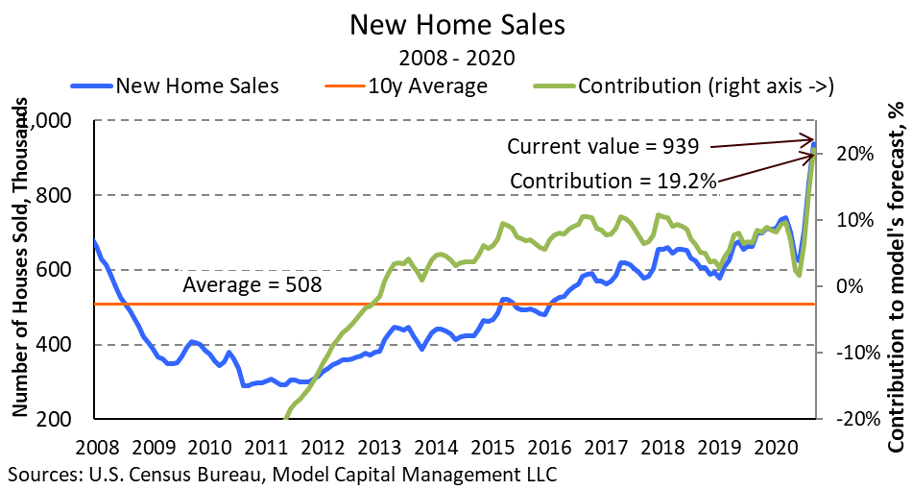
We’re seeing a significant shift in our fundamental Equity Model’s results. This change is driven partly by the market decline in September which made the market slightly less overvalued, but mostly by economic improvement, primarily in the housing market. The model’s factor composition also changed. Back in July, our negative forecast for the S&P 500 was attributed mainly to a weak economy, including extremely low consumer sentiment. The Economic component of the model improved tremendously over the past two months, and is now positive on strengthening in consumer sentiment and home sales.

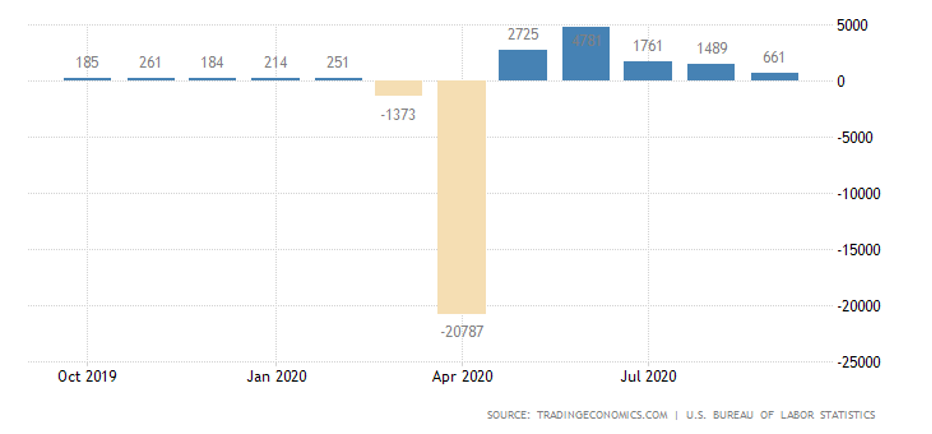
To be sure, the economy isn’t out of the woods – it’s still in the worst recession since 1946. While several economic factors that “matter” in our model improved, the labor market – including jobless claims and new payrolls – came in weaker than expected last month (see chart below). As I’ve written before, with its enormous stimulus Congress created an “unemployed class.” Stimulus negotiations between the Democrats and the GOP just ended, although the President said that he’s open to a separate airline bailout. Without it, the airline industry indicated that it would lay off over 30,000 people.

The Election Effect

Let me outline the expected effect of each candidate on the market the way I see it. Historical market performance shows that the S&P 500 rose by around 30% From Nov-2016 to Dec-2017 – first reflecting the effect of Donald Trump’s unexpected win, then his pro-growth policies, and finally the tax cut. Most of the S&P’s earnings rise in recent years occurred in 2018 due to the corporate tax cut – absent that, earnings are nearly unchanged from 2017. Joe Biden’s side indicated that they would raise taxes and would likely re-impose coronavirus-related lockdowns. Clearly, President Trump has been a positive “factor” for the stock market, and Biden would be negative.
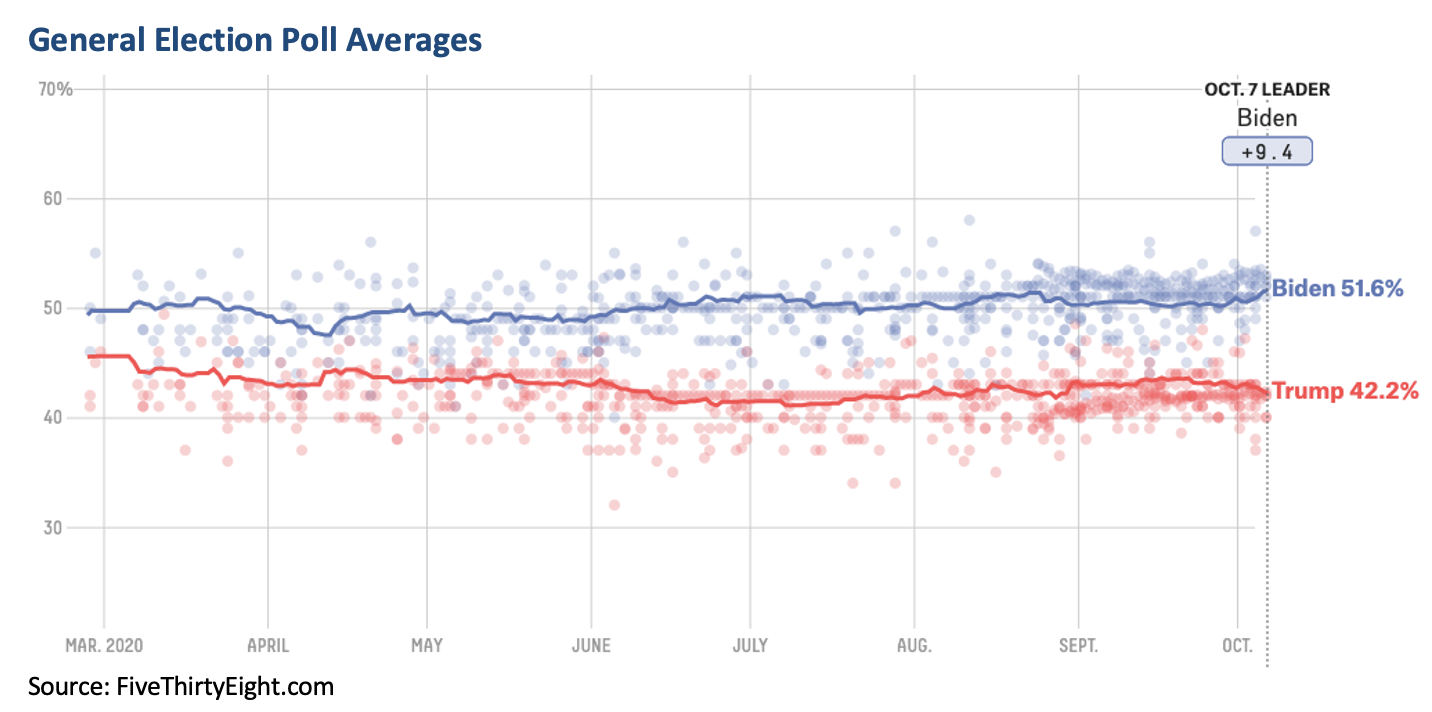
We have an apparent contradiction between stocks trading near all-time highs and a wide poll gap in Biden’s favor. Granted, polls have inherent biases, and they were very wrong in 2016. So, one explanation is that investors are ignoring mainstream polls entirely. The latest poll by Democracy Institute which correctly predicted both the 2016 general election and Brexit, show Trump being slightly ahead.
But given the size of the gap, it’s still surprising to me that the market hasn’t reflected a higher chance of a Biden win. It could get more “interesting” as we approach November 3rd. If such a wide gap persists this month, investors might reflect the chance of a Biden win by selling stocks. If it narrows somewhat, investors might get more concerned about an undecided or “unprocessed” election. Both circumstances could cause short-term market downside leading into the election.
About Model Capital Management LLC
Notices and Disclosures
2. MCM does not provide individually tailored investment advice. MCM Research has been prepared without regard to the circumstances and objectives of those who receive it. MCM recommends that investors independently evaluate particular investments and strategies, and encourages investors to seek the advice of an investment adviser. The appropriateness of an investment or strategy will depend on an investor’s circumstances and objectives. The securities, instruments, or strategies discussed in MCM Research may not be suitable for all investors, and certain investors may not be eligible to purchase or participate in some or all of them. The value of and income from your investments may vary because of changes in securities/instruments prices, market indexes, or other factors. Past performance is not a guarantee of future performance, and not necessarily a guide to future performance. Estimates of future performance are based on assumptions that may not be realized.
3. MCM Research is not an offer to buy or sell or the solicitation of an offer to buy or sell any security/instrument or to participate in any particular trading strategy. MCM does not analyze, follow, research or recommend individual companies or their securities. Employees of MCM may have investments in securities/instruments or derivatives of securities/instruments based on broad market indices included in MCM Research.
4. MCM is not acting as a municipal advisor and the opinions or views contained in MCM Research are not intended to be, and do not constitute, advice within the meaning of Section 975 of the Dodd-Frank Wall Street Reform and Consumer Protection Act.
5. MCM Research is based on public information. MCM makes every effort to use reliable, comprehensive information, but we make no representation that it is accurate or complete. We have no obligation to tell you when opinions or information in MCM Research change.
6. MCM DOES NOT MAKE ANY EXPRESS OR IMPLIED WARRANTIES OR REPRESENTATIONS WITH RESPECT TO THIS MCM RESEARCH (OR THE RESULTS TO BE OBTAINED BY THE USE THEREOF), AND TO THE MAXIMUM EXTENT PERMITTED BY LAW, MCM HEREBY EXPRESSLY DISCLAIMS ALL WARRANTIES (INCLUDING, WITHOUT LIMITATION, ANY IMPLIED WARRANTIES OF ORIGINALITY, ACCURACY, TIMELINESS, NON-INFRINGEMENT, COMPLETENESS, MERCHANTABILITY AND/OR FITNESS FOR A PARTICULAR PURPOSE).
7. “Model Return Forecast” for 6-month S&P 500 return is MCM’s measure of attractiveness of the U.S. equity market obtained by applying MCM’s proprietary statistical algorithm and historical data, but is not promissory, and, by itself, does not constitute an investment recommendation. Model Return Forecasts were calculated and applied by MCM to its research and investment process in real time beginning from 2012. For periods prior to Jan 2012, the results are “back-tested,” i.e., obtained by retroactively applying MCM’s algorithm and historical data available in Jan 2012 or thereafter. Source for the S&P 500 actual returns: S&P Dow Jones.
8. Index returns referenced in MCM Research, if any, are gross of any advisory fees, fund management fees, and trading expenses. Fund or ETF returns referenced, if any, are gross of advisory fees and trading expenses. Returns will be reduced by fees and expenses incurred.
9.

