The result enabled the market to have a strong rally with what we believe to be a new leader: value securities.

SVXK = S&P 500 Value Index. SP50 = S&P 500 Index. SGX = S&P 500 Growth Index
It has been overstated by many economists that we are in unprecedented territory with monetary policy. In fact, looking back from 1996 to current, there had never been a period where the dividend yield of the S&P 500 index exceeded the yield of the 10-year treasury bond until November 2008 (per data from Factset Research Systems). Of course, that was the peak of the financial crisis and began a series of quantitative easing and fed rates cuts by the federal reserve. This seems to have catapulted us into a new norm of low rates, which have since extended to international markets. Despite an average year over year quarterly earnings growth rate of 7.82% (Factset Research) of companies within the S&P 500, both Gross Domestic Product (“GDP”) and inflation in the U.S. have struggled to maintain or exceed 2% growth for each over the past 10+ years. Lack of global demand, trade disputes, and until recently, some of the government regulations have made it challenging to expand beyond those bounds.
The consequence has been the fed suppressing interest rates at record lows to enable liquidity to encourage more investment and purchasing. What has created further pressure for suppressed interest rates have been statements from the administration as well as accommodative policy globally. Although current U.S. rates are at record lows on a historical basis, it is important to introduce relative global context when analyzing how aggressive U.S. monetary is as opposed to historical domestic context.
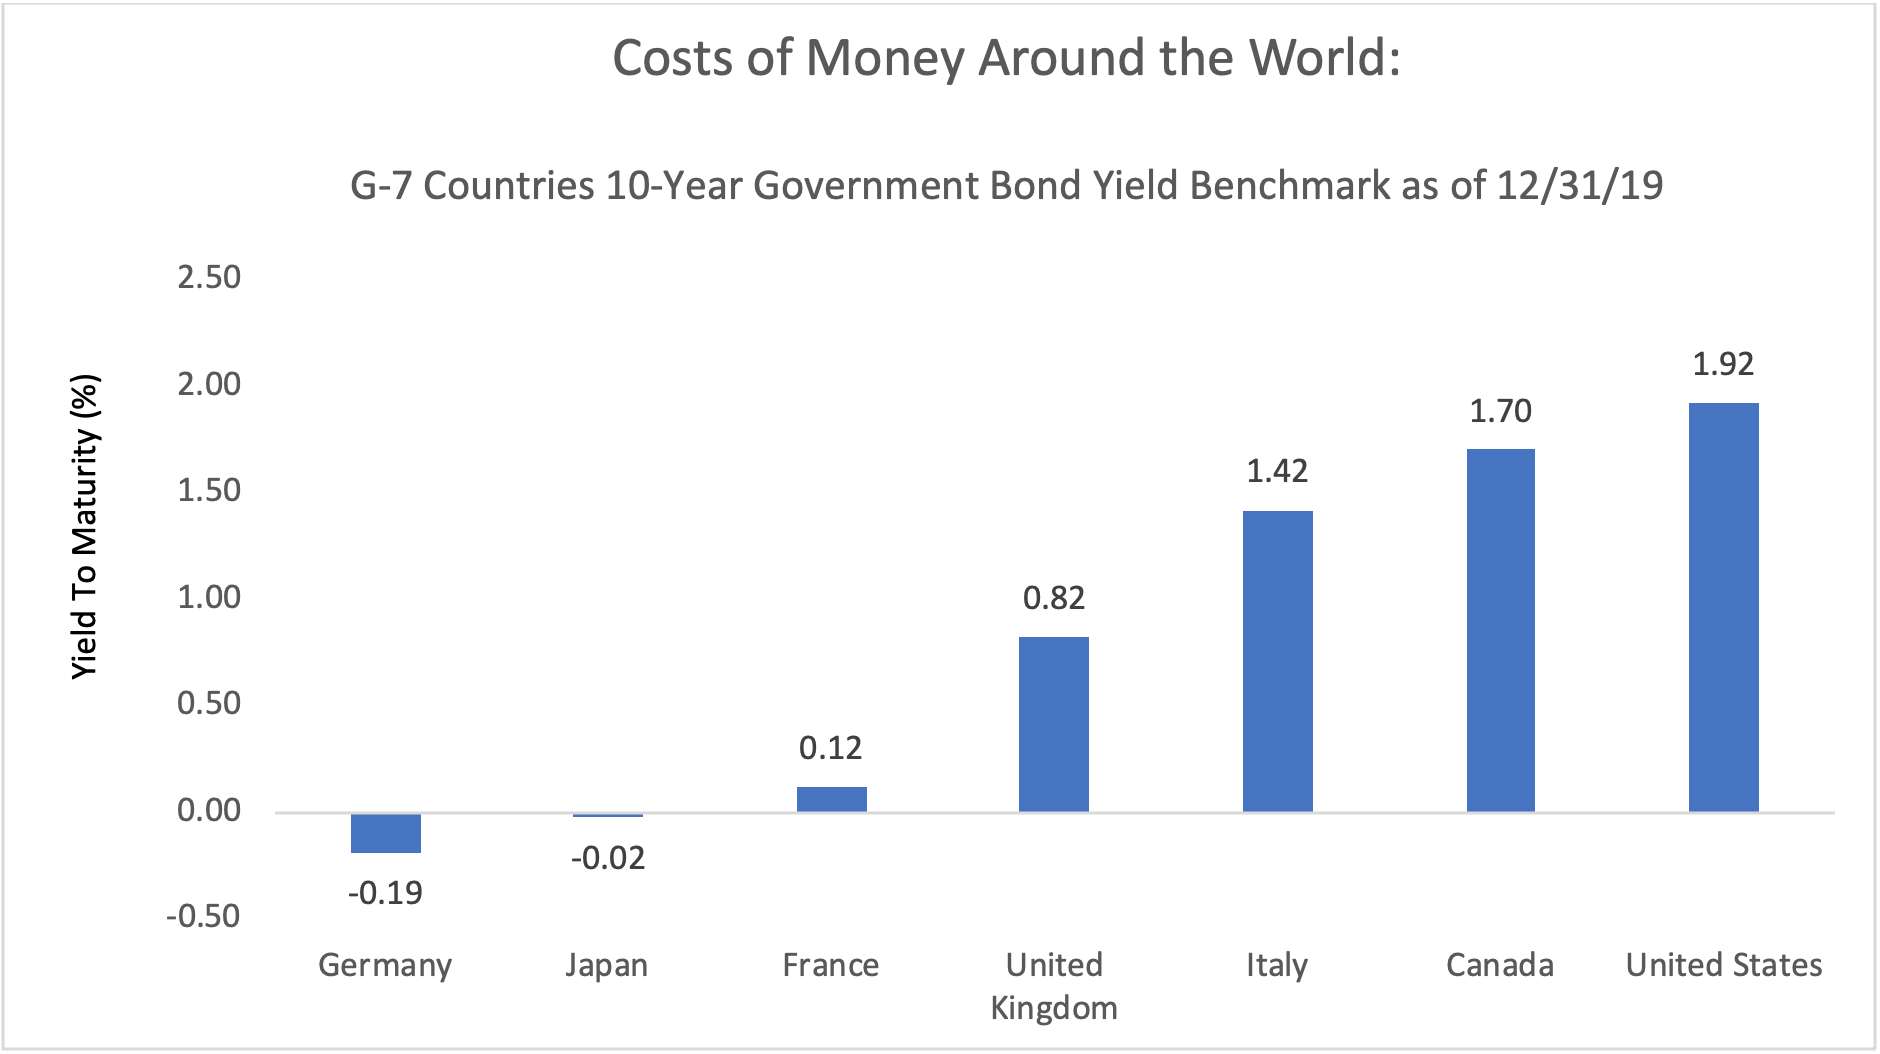
Below is a chart of the 10-Year treasury bond benchmarks for each of the G-7 countries:

As you can see, even despite the recent rate cuts in the U.S., we still remain have the highest yielding 10-year government bond among the largest developed countries. This scale suggests that not only is the U.S. monetary policy appropriate, but it can be argued that there is room for further accommodation. However, some economists will argue that further accommodative monetary policy would leave the federal reserve with little ammunition in the event of a full blow recession. While the “save for a rainy-day jar” approach seems prudent, Global Beta believes monetary policy ought not to be determined based on “what if’” or “could be”. However, as the federal reserve indicated in their recently published December minutes, it does not appear they are ready to take action either way any time soon.
With monetary policy seemingly no longer an uncertainty for the foreseeable future, what does mean for investors?
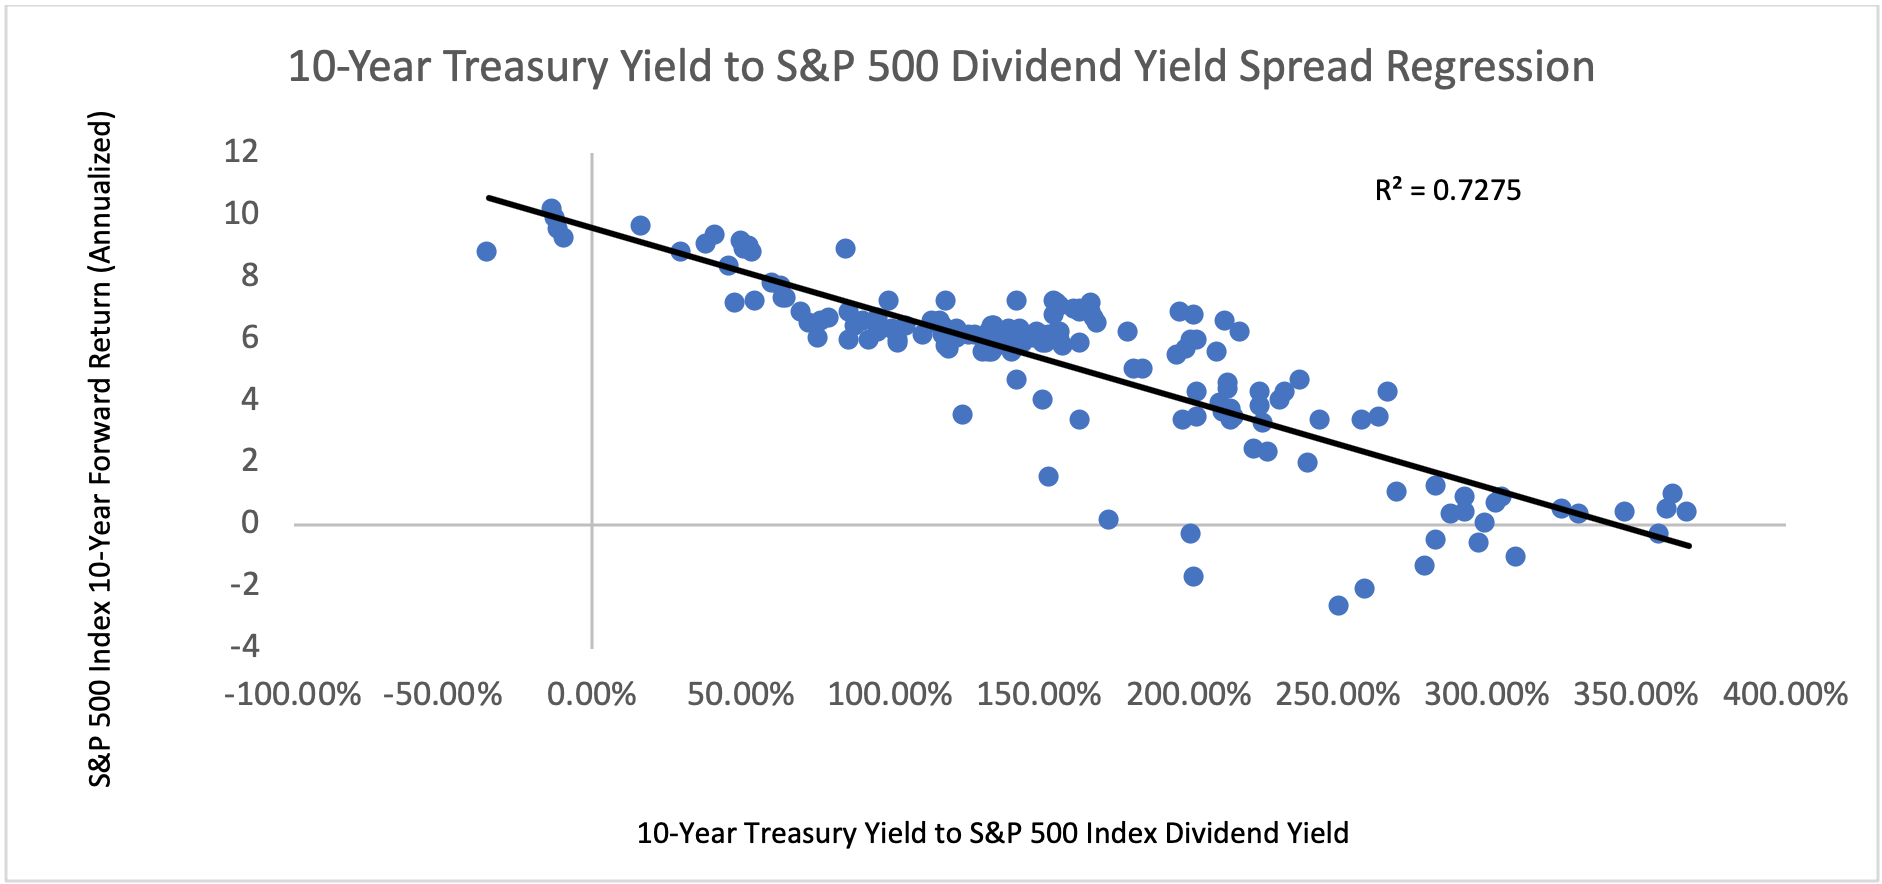
In a world that is seemingly devoid of yield, Global Beta believes that may in fact be the theme for investment for quite some time. We went back to 1996 to analyze the spread between the dividend yield of the S&P 500 index and the yield of the 10-year treasury bond to determine what kind of relationship that has with the prospect of future returns. Historically, the spread between the 10-year treasury yield and the S&P 500 Index has generally been quite wide (in favor of the 10-year). However, it appears that when that spread narrows, there is a high correlation of future 10 year returns on the S&P 500 index being higher than when the spread is wider. This evidence makes sense as when the spread narrows, that indicates that monetary policy is becoming more accommodative, introducing more liquidity into the market place, enabling investors to utilize that liquidity for riskier investment.
Below is a regression chart illustrating that effect. The chart plots out each month from 1996 through 12/31/19 of what the spread between the 10-year yield and the S&P 500 index dividend yield was and the corresponding forward looking 10-year return:

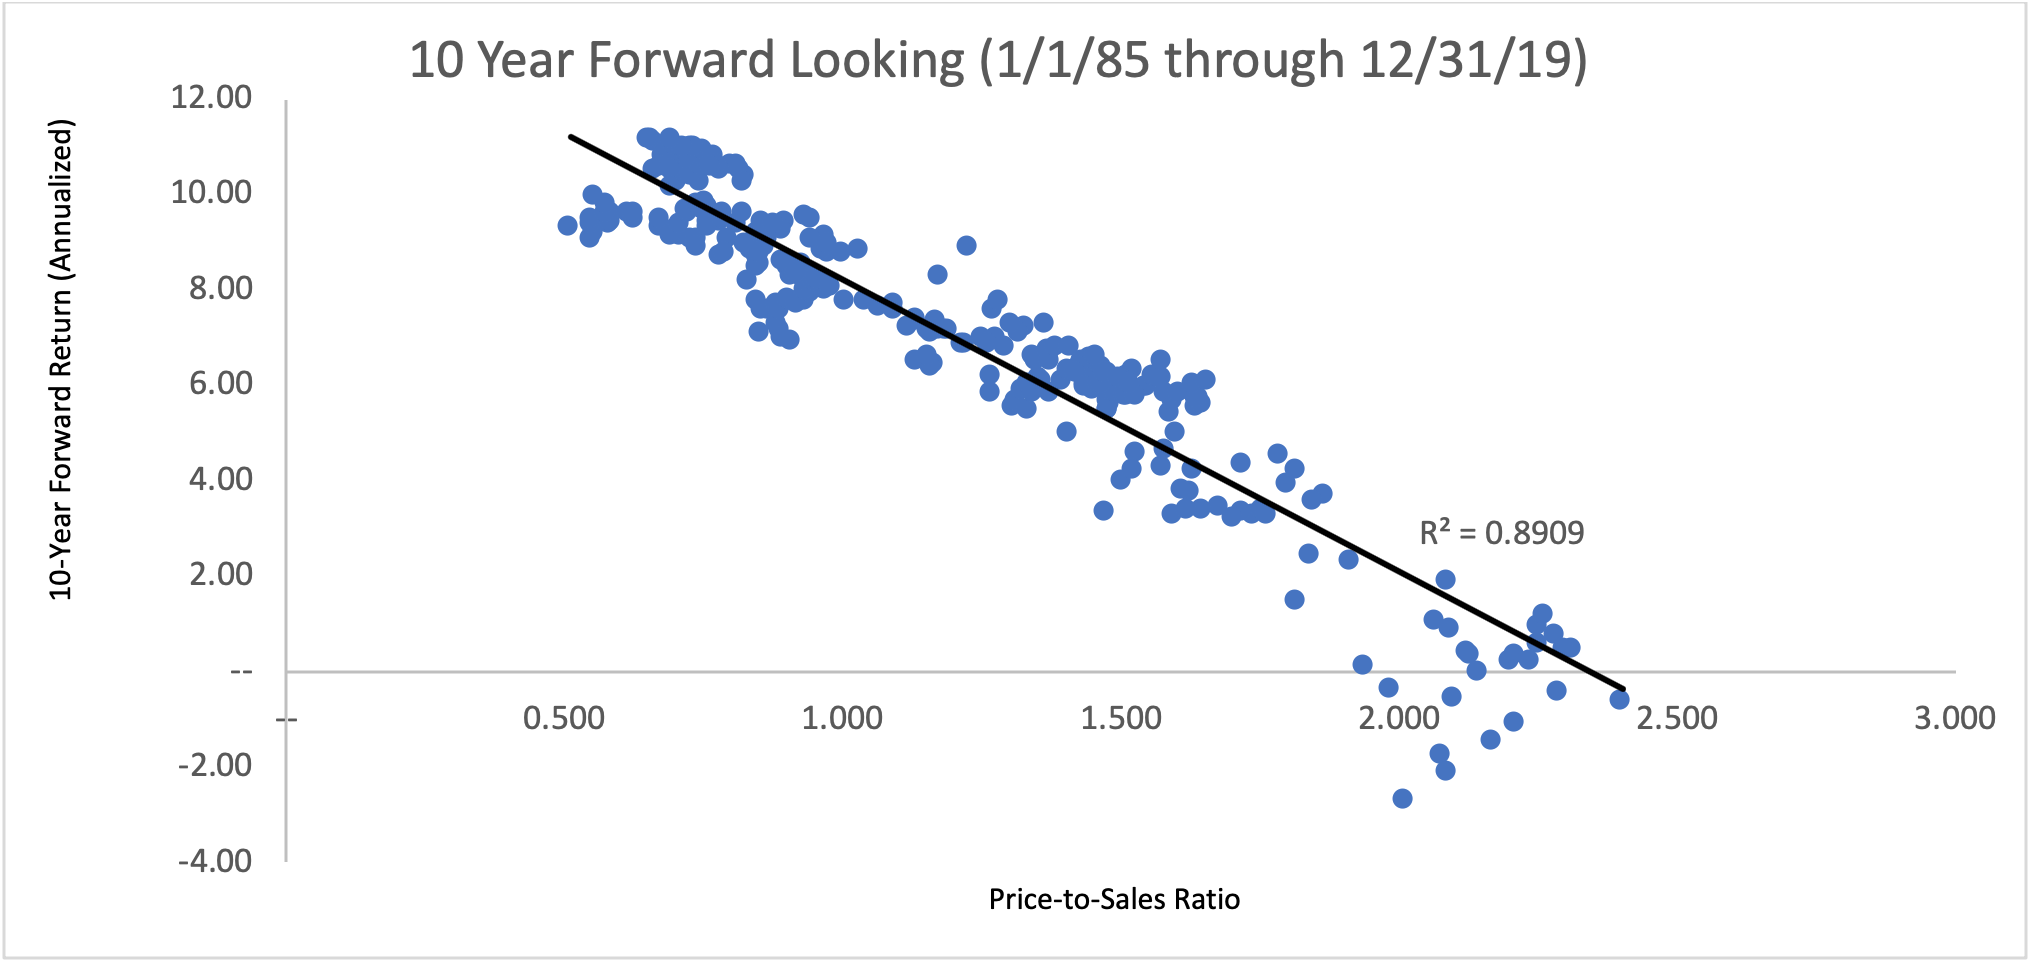
We believe the above chart demonstrates the type of environment we are currently in. The current spread between the 10-year treasury yield and the S&P 500 dividend yield is -0.71%. The above research suggests that there is a high probability that equity investments will have a higher than normal long-term return. However, it is important to note that, as of 12/31/19, the current price-to-sales ratio of the S&P 500 index is approximately 2.4, which is historically high. Global Beta believes it is important to consider valuation when positioning for long term success.
Below is a regression analysis plotting the monthly price to sales ratio of the S&P 500 back to 1985 and its corresponding 10-year forward looking return:

The above analysis illustrates the importance of valuation when positioning for long term return growth. Considering the aforementioned global macro economic environment, Global Beta believes investors should consider value-oriented strategies with decent yield. We believe that approach will allow investors to take advantage of the current opportunity of high liquidity and a high level of appetite for risk assets at a cheaper price while earning quarterly income.
Justin Lowry is the Chief Investment Officer for Global Beta Advisors, in Philadelphia, PA.

