At the time of this writing, with certain exceptions, it appears the third wave of cases in the U.S. is beginning to wane. Covid-19 is likely on its way to becoming another endemic virus, where some level of immunity acquired through a mix of vaccination and natural exposure decreases its impact on society. It will take time to get there, with more disruptions along the way, but we are optimistic about our current trajectory.
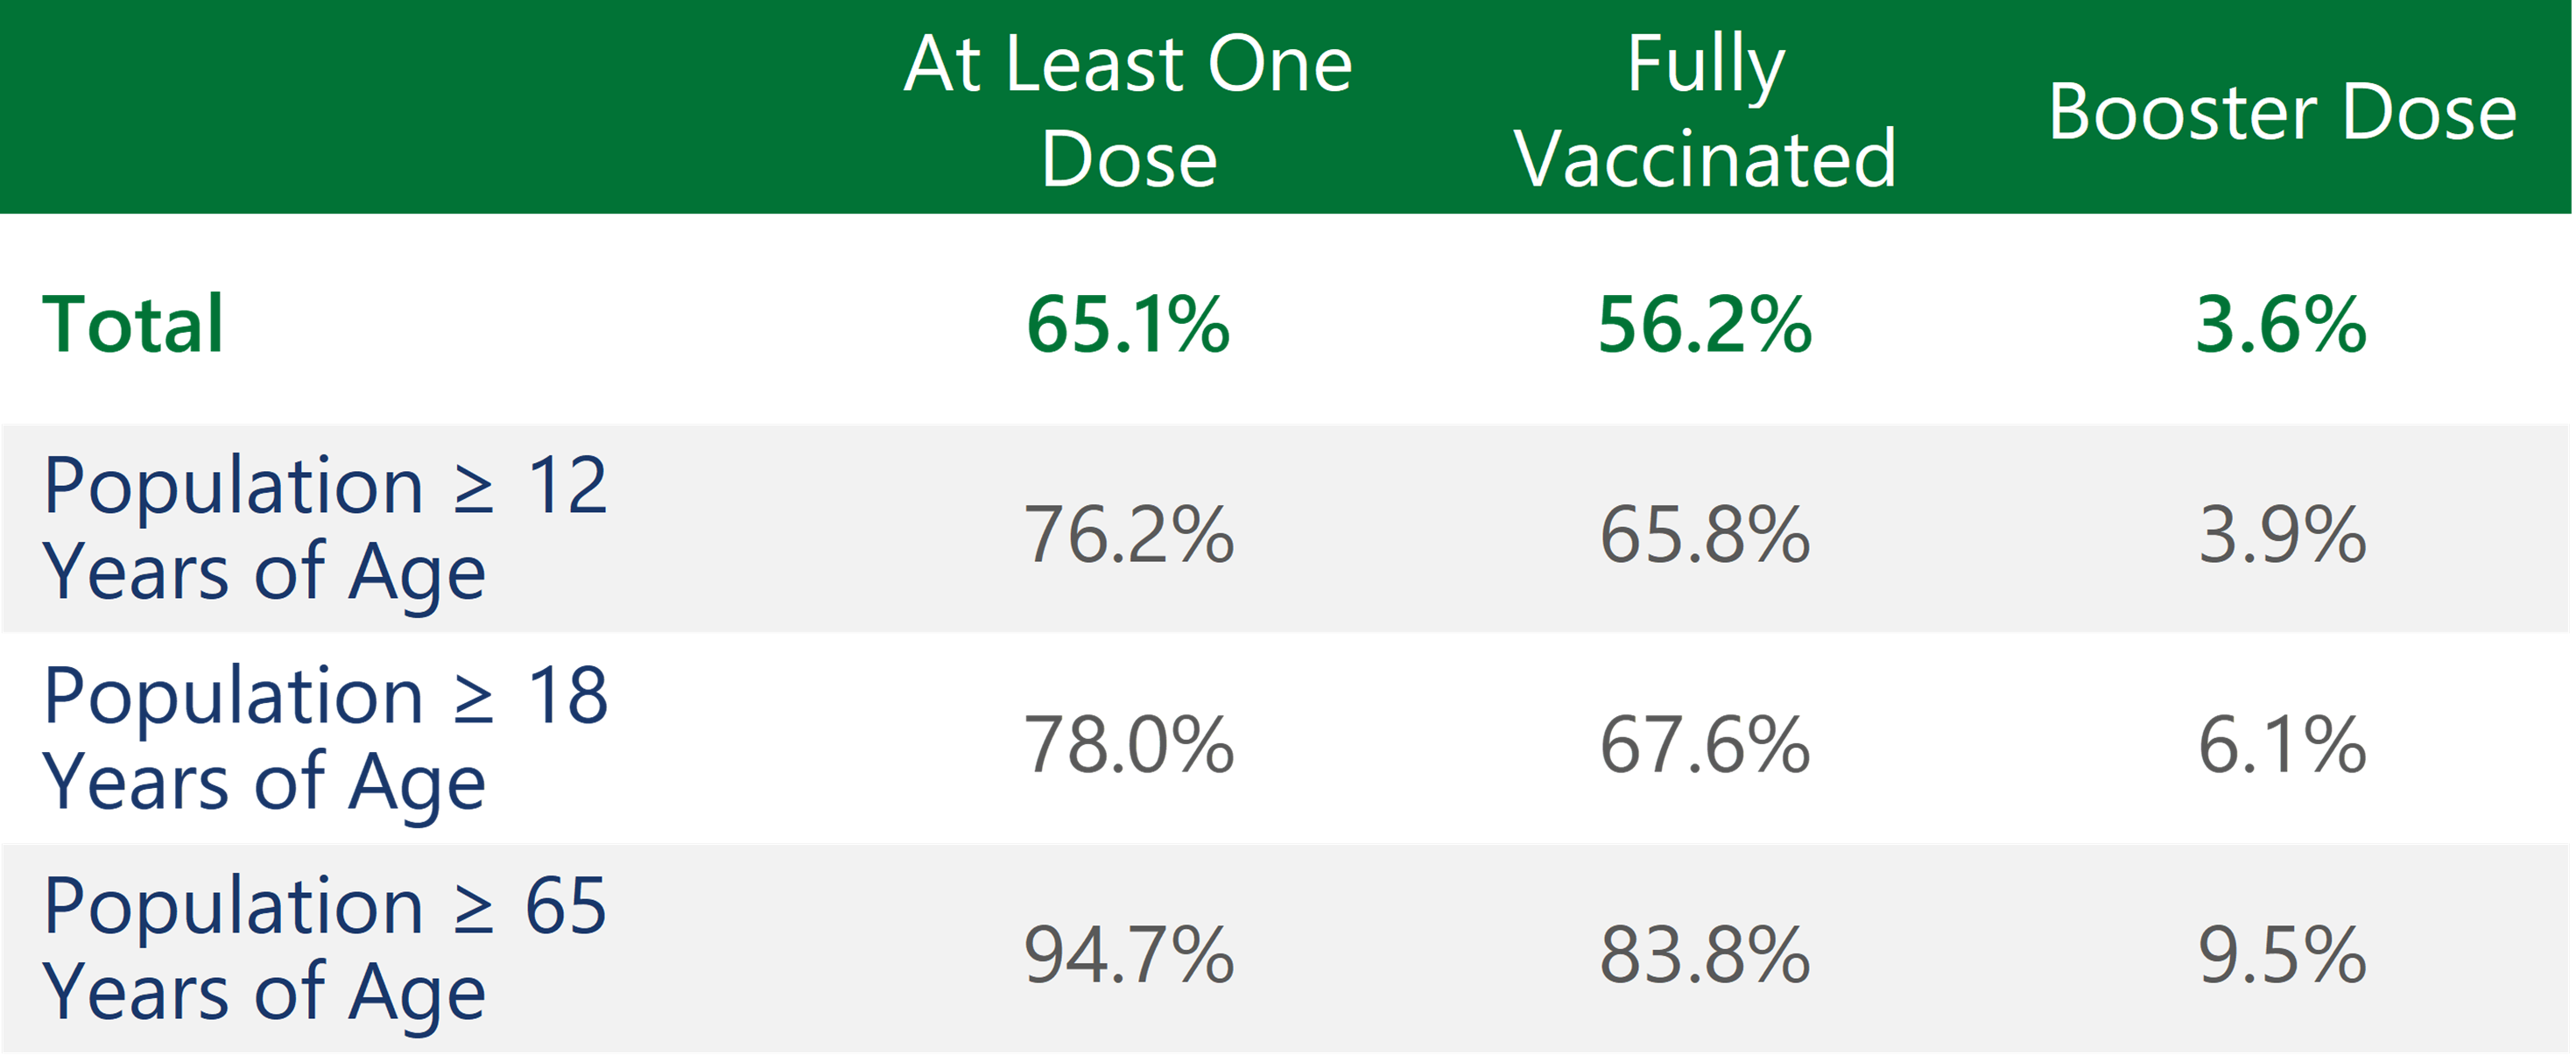
Source: Centers for Disease Control and Prevention. Data as of 10/7/2021.
The most recent wave of cases, driven by the more virulent Delta variant, had a predictably negative impact on the economy. Hiring slowed and growth expectations fell, while supply chain issues continued to worsen. Due to the global nature of supply chains, domestic issues were exacerbated by the spread of Covid in various international manufacturing and shipping hubs. This mix of slower growth, higher unemployment, and inflationary pressures has reawakened fears of Stagflation. While this is a possible outcome, it will require a catalyst to push inflation higher in the face of a slowing economy. Oil served as the catalyst in the 1970s, but we believe the advent of fracking makes a sustained energy crisis in the U.S. unlikely. Supply chain bottlenecks are helping drive inflation higher in the short term, but we don’t believe this will be a long-term source of inflation.
As vaccination rates continue to climb here and abroad, Covid-induced disruptions should decrease in both frequency and severity. Profit is a powerful motivator and as such, there’s a massive incentive to correct supply chain issues. In short, we believe that higher prices don’t exacerbate supply chain issues (an example of a feedback loop)—they eventually solve them. Higher prices increase investment in supply chains and decrease demand until an equilibrium is found. Along these lines, the big question that we’re asking ourselves is: what economic developments could lead to a feedback loop that pushes the economy away from the pre-pandemic status quo?
Source: Federal Reserve Bank of Atlanta. Data for the period December 1997 through August 2021.
We believe that the most likely source of a feedback loop leading to higher economic growth and higher inflation is wage growth. Faster wage growth, especially at the lower end of the pay scale, increases demand, which drives prices, investment, and wages (the feedback loop) higher. As such, we’ve spent time trying to understand the confusing labor market dynamic that we currently find ourselves in. Despite the economic recovery’s strong growth, unemployment has remained elevated. Like many others, we assumed that the expiration of the extended unemployment benefits would lead to an increase in employment, but early indications don’t offer strong support for that narrative. Government benefits, which recently ended nationwide, are surely still a driver of higher unemployment, but they don’t appear to be the only driver.
The question is, why is the labor market so much stronger at a 5.2% unemployment rate in 2021 than it was at the same unemployment rate in 2015? Of course, there’s not one simple answer, but a possible explanation is that the labor force is more constrained than it was previously. Back in 2015 and the years following, one of the larger topics of debate was centered around the so-called non-accelerating inflation rate of unemployment (NAIRU). Economists expected inflation to increase as unemployment continued to decrease, but the unemployment rate eventually fell to generational lows without any substantial inflationary pressures. The reason is largely because the labor force participation rate began to rise, indicating that there was much more slack in the labor market than the unemployment rate would have suggested. Additional workers were drawn back into the labor force as the recovery continued.
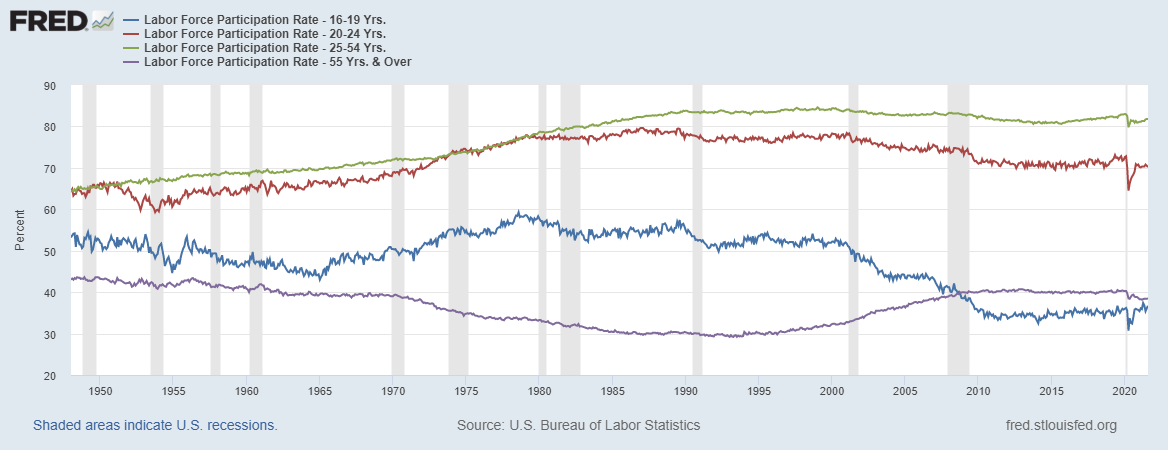
Source: U.S. Bureau of Labor Statistics. Data for the period 1/1/1948 through 8/31/2020.
This same phenomenon may happen at some point in our current recovery, but for the time being it seems possible that the labor force is far more constrained. Interestingly, 16-19 years is the only age group with a higher labor force participation rate and a lower unemployment rate than prior to the pandemic. Conversely, 55 years and older is the only age group with a labor force participation rate that is currently lower than it was in April of 2020 as millions of Baby boomers retired. The pace of retirements accelerated as equity and house price appreciation drove the largest inflation-adjusted year-over-year increase in household net worth in at least the past 50 years. Lastly, the largest labor cohort, 25-54 years, is the most likely to have children and as the pandemic has continued, childcare has moved up the list of reasons Americans aren’t working1.
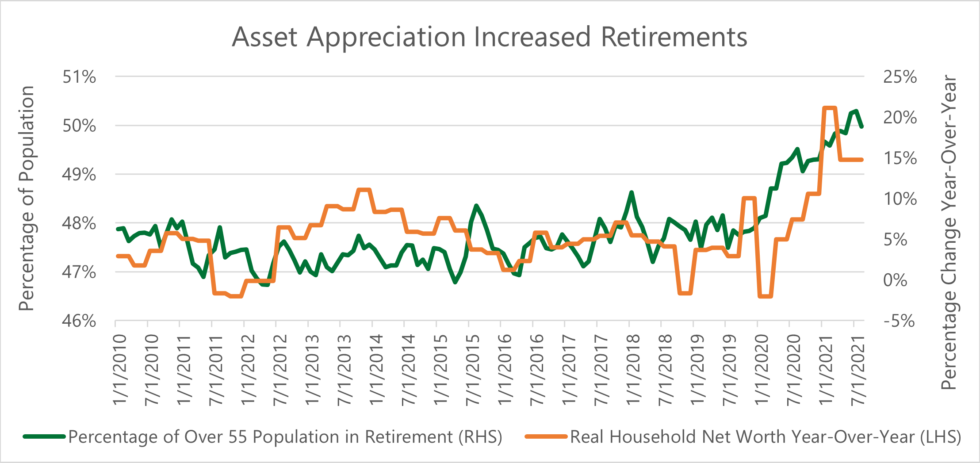
Source: St. Louis Fed, the Board of Governors of the Federal Reserve System and Organization for Economic Co-operation and Development. Real Household Net Worth was derived from Households and Nonprofit Organizations; Net Worth, Level, Billions of Dollars, Quarterly, Inflation Adjusted with Consumer Price Index: Total All Items for the United States. Percentage of Over 55 Population in Retirement was derived from the United States Census Bureau’s Current Population Survey supplemental microdata. Data for the period 1/31/2010 through 8/31/2021.
All in all, it seems possible that there are millions of Americans who have effectively withdrawn from the labor force, at least for the time being. If these conditions continue, it seems likely that the labor market will remain strong—driving faster wage growth, economic growth, and inflation. These are positive developments for the average American, but a strong labor market with increasing inflation has historically produced a bumpy ride for investors. Not all price increases can be passed through to consumers, which will lead to margin pressures. If interest rates were to rise as well, it may prove to be a difficult period for the traditional passive portfolios that investors have come to rely upon. We believe that these conditions will benefit active managers such as ourselves and we look forward to the opportunities that lie ahead.
References
- 1. Jillian McGrath. “Child Care in Crisis.” Third Way. https://www.thirdway.org/memo/child-care-in-crisis. February 24th, 2021.
Disclaimer
Copyright © 2021 Beaumont Capital Management LLC. All rights reserved. All materials appearing in this commentary are protected by copyright as a collective work or compilation under U.S. copyright laws and are the property of Beaumont Capital Management. You may not copy, reproduce, publish, use, create derivative works, transmit, sell or in any way exploit any content, in whole or in part, in this commentary without express permission from Beaumont Capital Management.
Past performance is no guarantee of future results. Index performance is shown on a gross basis and an investment cannot be made directly in an index. The performance of any ETFs, as contributors or detractors to the strategy, are provided on a gross basis. An Exchange Traded Fund (ETF) is a security that tracks an index, a commodity or a basket of assets like an index fund, but trades like a stock on an exchange. ETFs experience price changes throughout the day as they are bought and sold. All BCM strategies invest only in long-only ETFs.
This material is provided for informational purposes only and does not in any sense constitute a solicitation or offer for the purchase or sale of a specific security or other investment options, nor does it constitute investment advice for any person. The material may contain forward or backward-looking statements regarding intent, beliefs regarding current or past expectations. The views expressed are also subject to change based on market and other conditions. The information presented in this report is based on data obtained from third party sources. Although it is believed to be accurate, no representation or warranty is made as to its accuracy or completeness.
As with all investments, there are associated inherent risks including loss of principal. Stock markets, especially foreign markets, are volatile and can decline significantly in response to adverse issuer, political, regulatory, market, or economic developments. Sector and factor investments concentrate in a particular industry or investment attribute, and the investments’ performance could depend heavily on the performance of that industry or attribute and be more volatile than the performance of less concentrated investment options and the market as a whole. Securities of companies with smaller market capitalizations tend to be more volatile and less liquid than larger company stocks. Foreign markets, particularly emerging markets, can be more volatile than U.S. markets due to increased political, regulatory, social or economic uncertainties. Fixed Income investments have exposure to credit, interest rate, market, and inflation risk.
Diversification does not ensure a profit or guarantee against a loss.
The Standard & Poor’s (S&P) 500® Index is an unmanaged index that tracks the performance of 500 widely held, large-capitalization U.S. stocks. Indices are not managed and do not incur fees or expenses. The S&P Small Cap 600® Index is an unmanaged index that tracks the performance of 600 widely held, small-capitalization U.S. stocks. The MSCI World Index is a free float-adjusted market capitalization weighted index that is designed to measure the equity market performance of developed markets. The MSCI World ex-U.S. Index is a free float-adjusted market capitalization weighted index that is designed to measure the equity market performance of developed markets, excluding the United States. The MSCI ACWI Index captures large and mid-cap representation across 23 Developed Markets and 26 Emerging Markets countries. The MSCI ACWI Index ex-U.S. captures large and mid-cap representation across 22 Developed Markets and 26 Emerging Markets countries, excluding the United States. The Bloomberg Barclay’s U.S. Aggregate Bond Index is a broad base index and is often used to represent investment grade bonds being traded in the United States. The Bloomberg Barclay’s U.S. Aggregate Bond Index is a broad base index and is often used to represent investment grade bonds being traded in the United States.
“S&P 500®”, and “S&P Small Cap 600®” are registered trademarks of Standard & Poor’s, Inc., a division of S&P Global, Inc. MSCI® is the trademark of MSCI Inc. and/or its subsidiaries.
For Investment Professional use with clients, not for independent distribution.
Please contact your BCM Regional Consultant for more information or to address any questions that you may have.
Beaumont Capital Management was originally created in 2009 as a separate division of Beaumont Financial Partners, LLC. Beaumont Capital Management LLC spun off as its own entity as of 1/2/2020. Beaumont Financial Partners, LLC was originally registered as Beaumont Trust Associates in 1981 and was reorganized into Beaumont Financial Partners, LLC in 1999.
Beaumont Capital Management LLC, 75 2nd Ave, Suite 700, Needham, MA 02494 (844-401-7699)
David M. Haviland a Managing Partner of the firm and Lead Portfolio Manager of Beaumont Capital Management (BCM). Check out his full bio here.